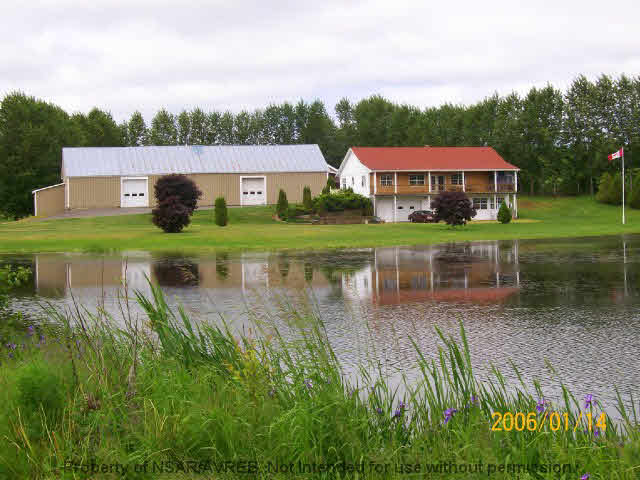
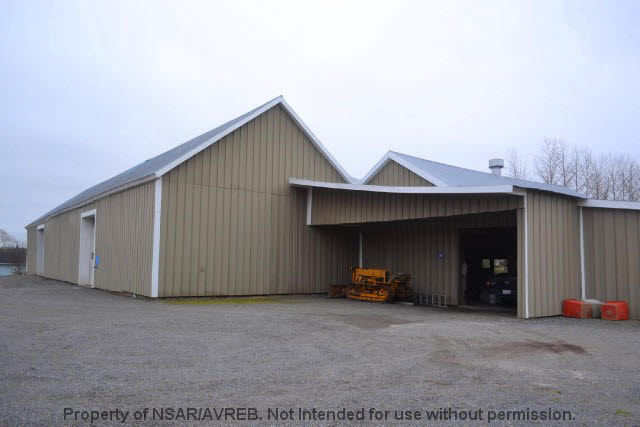
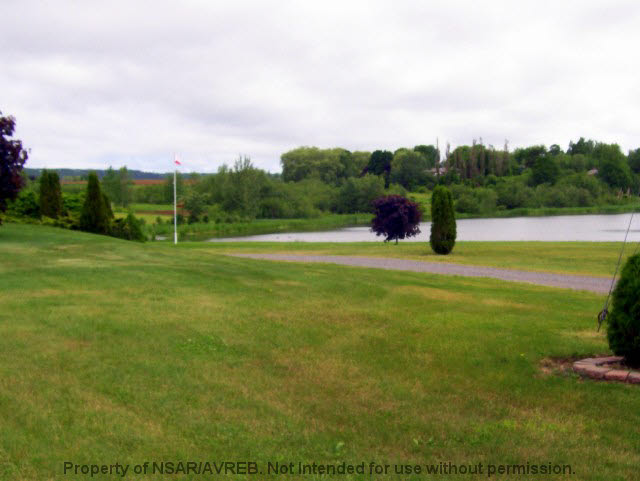
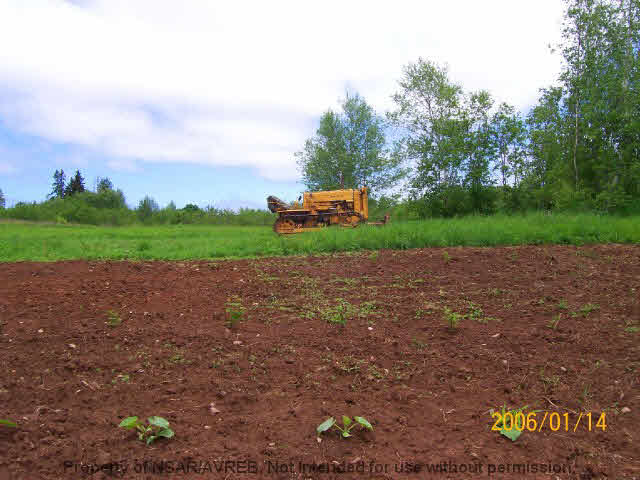
9641 HIGHWAY 221, Canning, B0P 1H0 MLS® 201707344
Listing Details
Status
ACTIVE
ACTIVE
Listing Price
$1,620,000
$1,620,000
MLS®
201707344
201707344
Type
Single Family
Single Family
Style
Detached
Detached
Age
16
16
Square Footage (MLA)
2,400 ft2
2,400 ft2
Total Fin SqFt (TLA)
4,800 ft2
4,800 ft2
PID
55373971
55373971
Bedrooms
4
4
Full Baths
2
2
Water
Municipal
Municipal
Sewer
Municipal
Municipal
Heating/Cooling Types
Radiant,Stove
Radiant,Stove
Utilities
Cable,Electricity,High Speed Internet,Telephone
Overview
For more info click Multimedia - Two parcels (total 49.64 acres), house, barn and lake in the heart of the picturesque village of Canning. Municipality approved for residential development. Serviced by municipal sewer and water, and short walk to P- 2 schools. - For more info click Multimedia
Building Specs.
Foundation Type
Concrete
Concrete
Roof
Metal
Metal
Exterior Finish
---
---
Flooring
Ceramic,Hardwood,Porcelain
Looking for a Mortgage? Get Your Free Quote Started Today!
Rooms
LEVEL | TYPE | DIMENSIONS |
---|---|---|
Lower Level | Bedroom | 13X12 |
Lower Level | Family Room | 36X19 |
Main Floor | Living Room | 26.6X24.8 COMBO DR |
Main Floor | Kitchen | 10X12.10 |
Main Floor | OTHER | 7.3X6.7 |
Main Floor | Master Bedroom | 15.2X26.4 |
Main Floor | Ensuite Bath 1 | 4PC |
Main Floor | Bath 1 | 4PC |
Main Floor | OTHER | 7.9X14 |
Main Floor | Bedroom | 13.3X10.7 |
Main Floor | Bedroom | 13.4X10.7 |
Virtual Tour
Garage & Parking
Garage
Y
Y
Details
N/A
N/A
Inclusions
None
Exclusions
None
Demographic Data
Demographic data is based on the dissemination area that contains the listing parcel . Dissemination Areas are small areas composed of one or more neighbouring dissemination blocks. All of Canada is divided into dissemination areas. Data source: Environics Analytics via ArcGIS Online, 2017
Population Size
550
Median Age
43.6
Avg Household Size
2.6
Avg Household Income
$54K
The number of people for each age range.
How the population of this area is expected to change.
The highest level of education obtained by people within this area.
The maritial status of the people in this area.
The average household income within this area.
The number of people that rent versus own.
When the buildings in the area were constructed.
The number of children at home for the given age ranges.
The occupations of the people living here.
Tax Assessment
Year | Amount | % Change |
---|---|---|
2018 | $440,600 | 0.6 |
2017 | $443,100 | 2.2 |
2016 | $433,700 | 1.3 |
2015 | $439,400 | 1.0 |
2014 | $435,200 | 2.7 |
2013 | $423,800 | 6.6 |
2012 | $397,700 | --- |
Maps
Last Updated On: 3/12/2020 3:41:35 PM (UTC)