
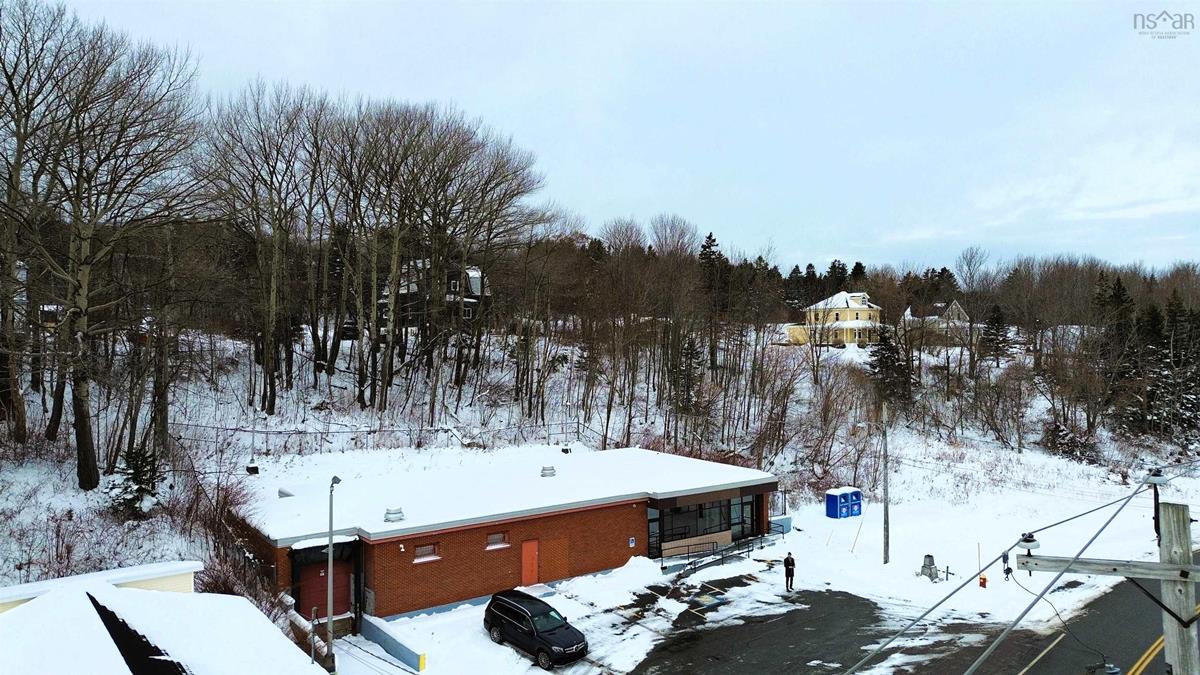
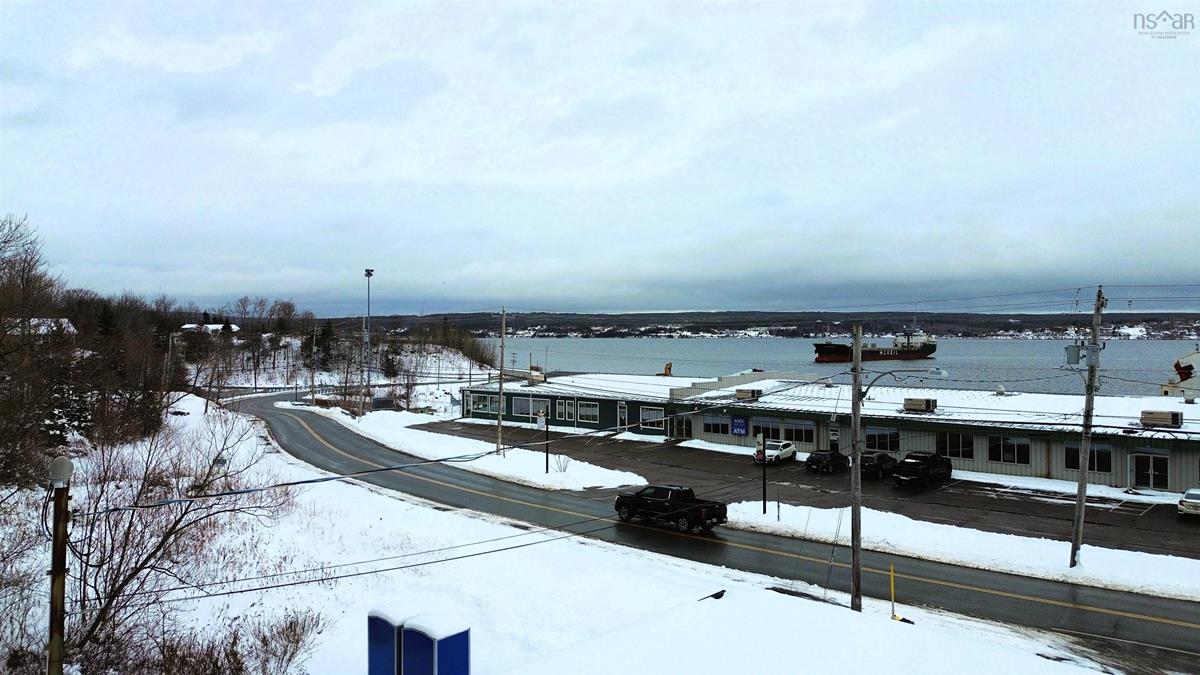
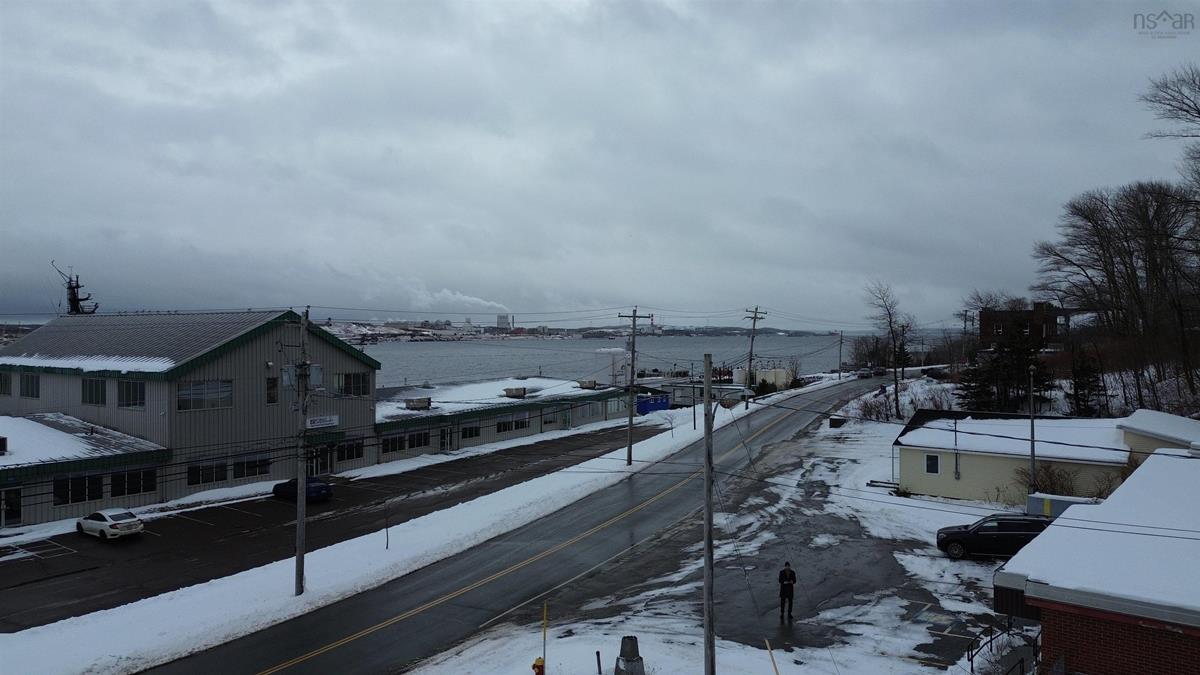
419 Main Street, Mulgrave, (MLS® 202628478) REMAX NOVA
Google Play iOS Google Play iOS

419 Main Street, Mulgrave

3687 sqft
$11 For Sale

Description

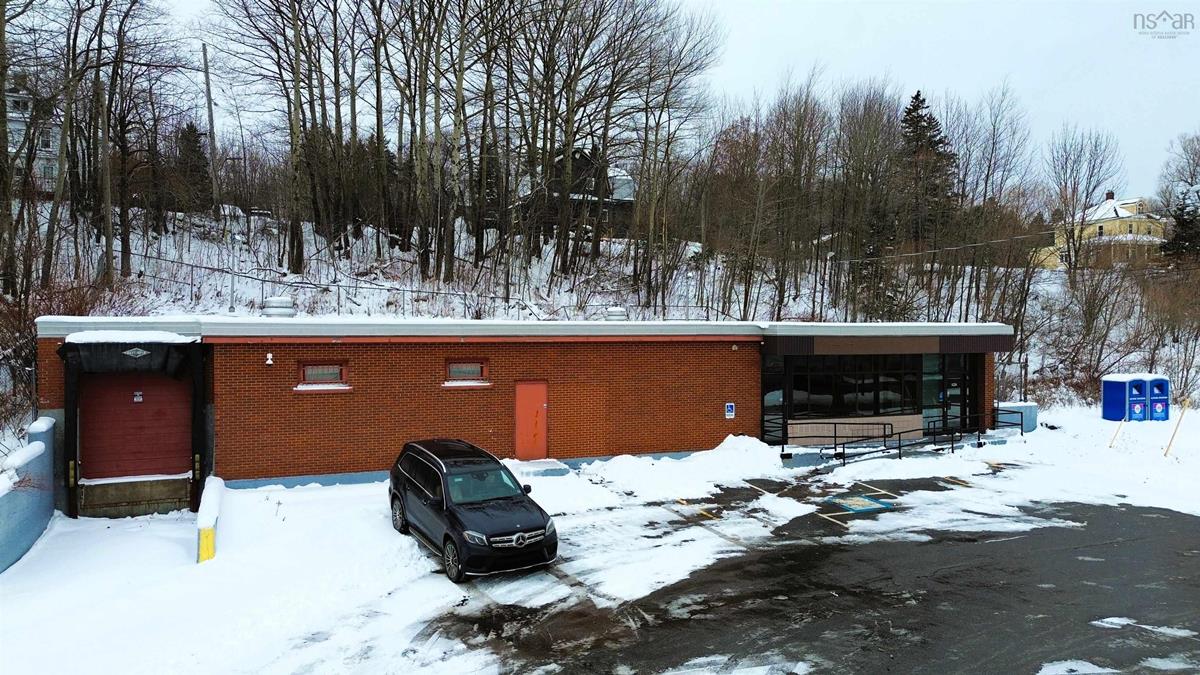
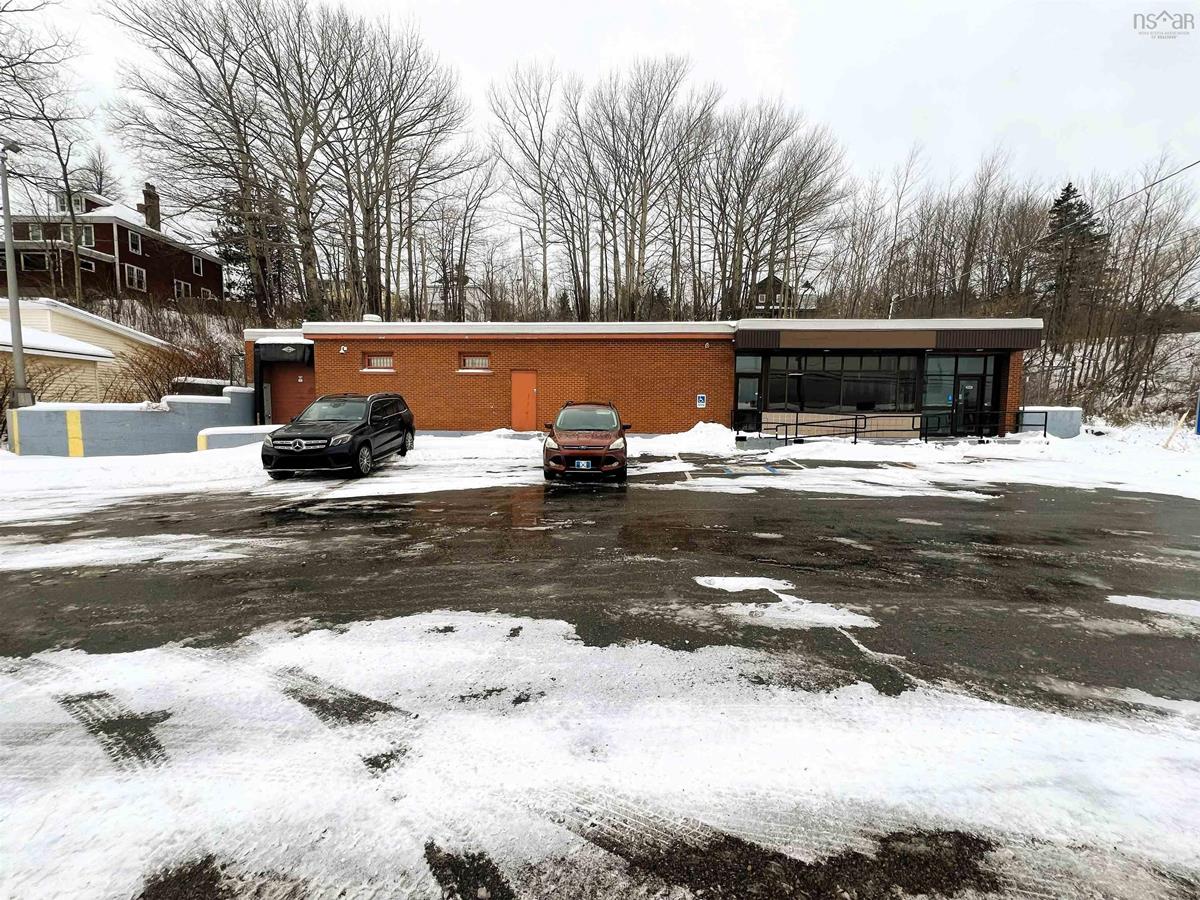
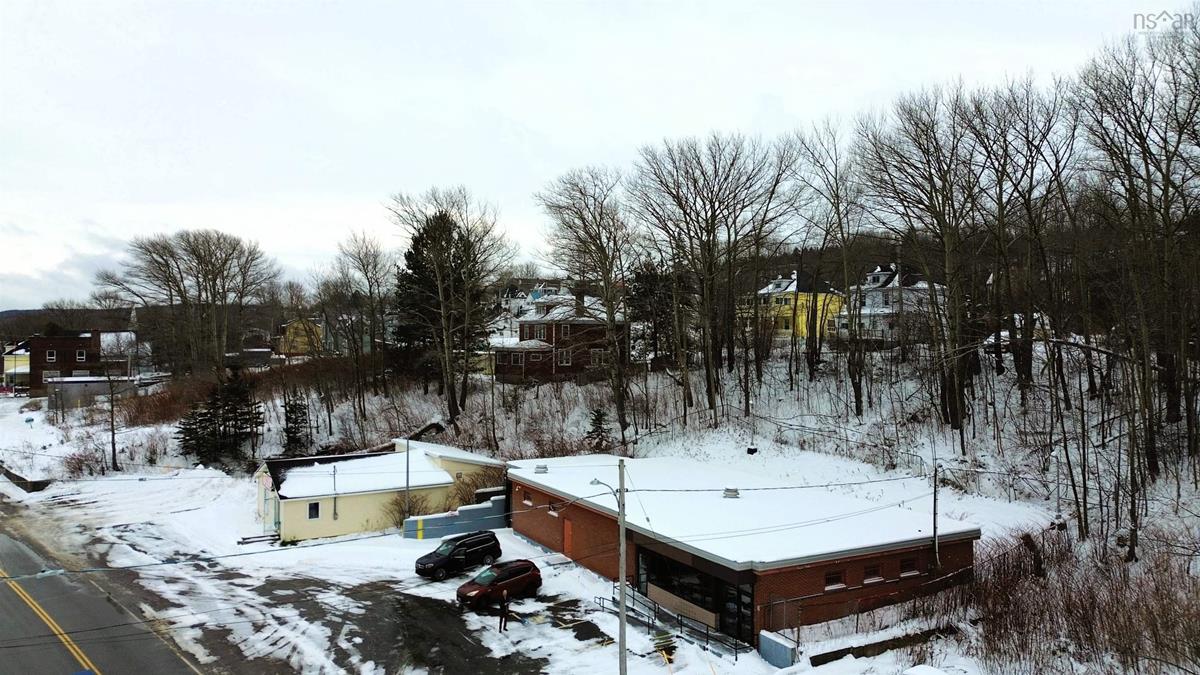
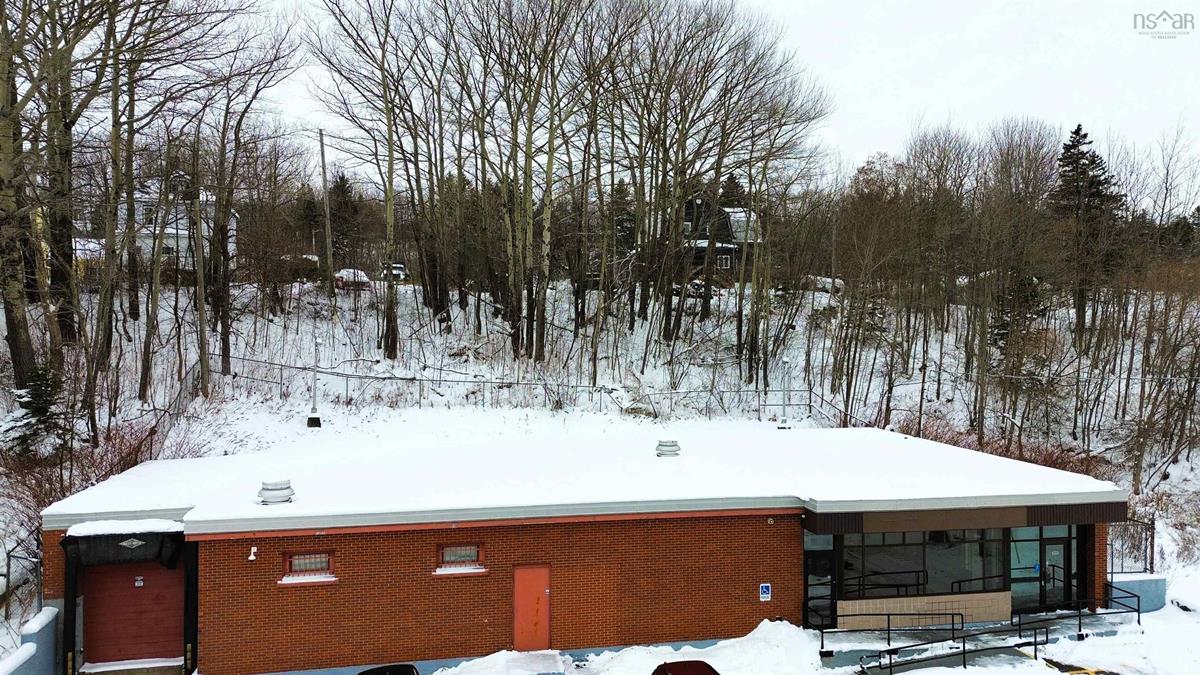
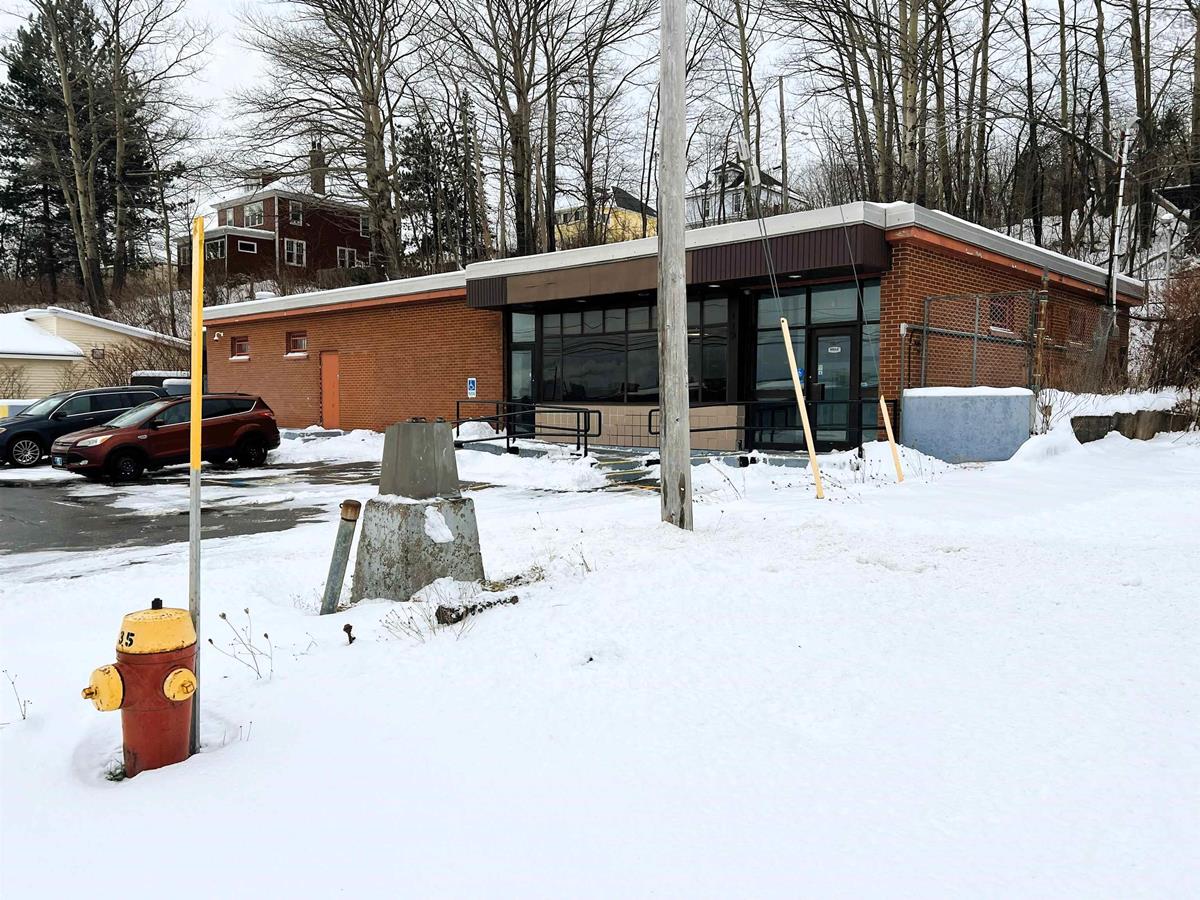
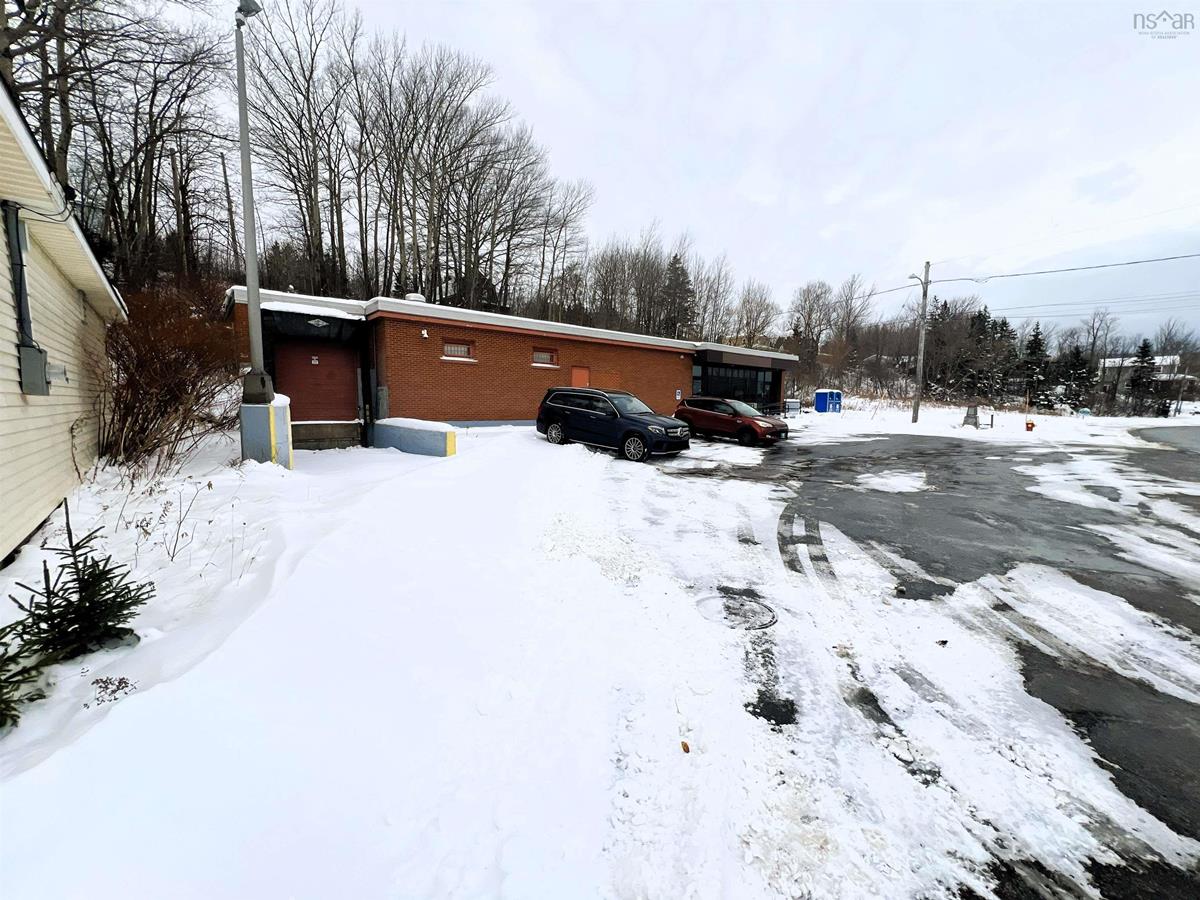
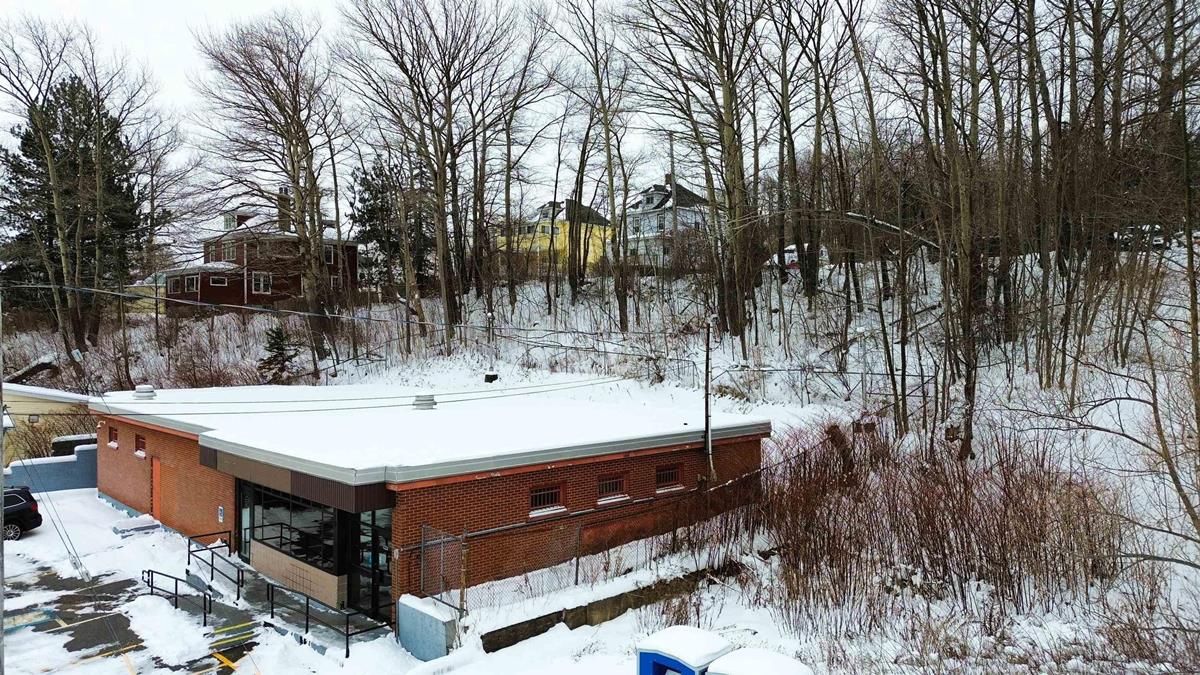
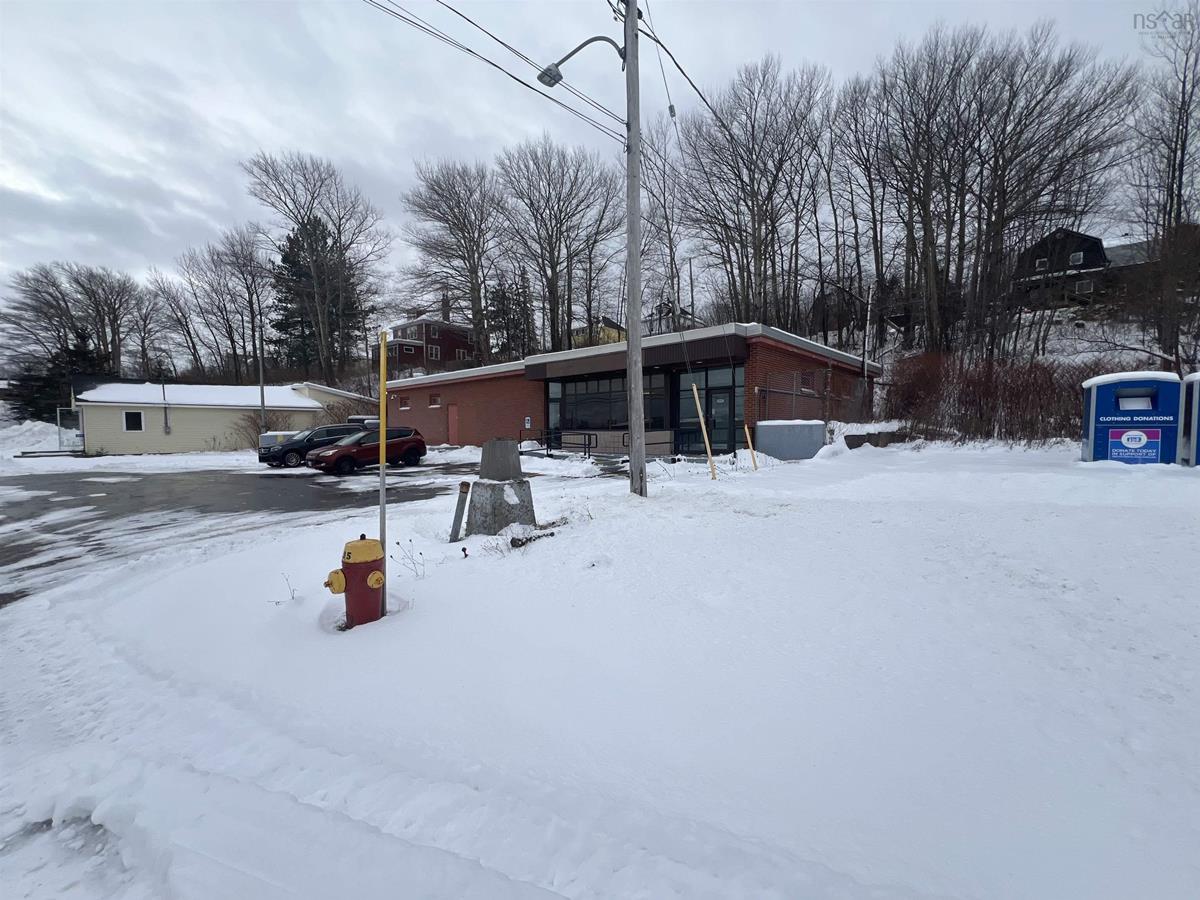
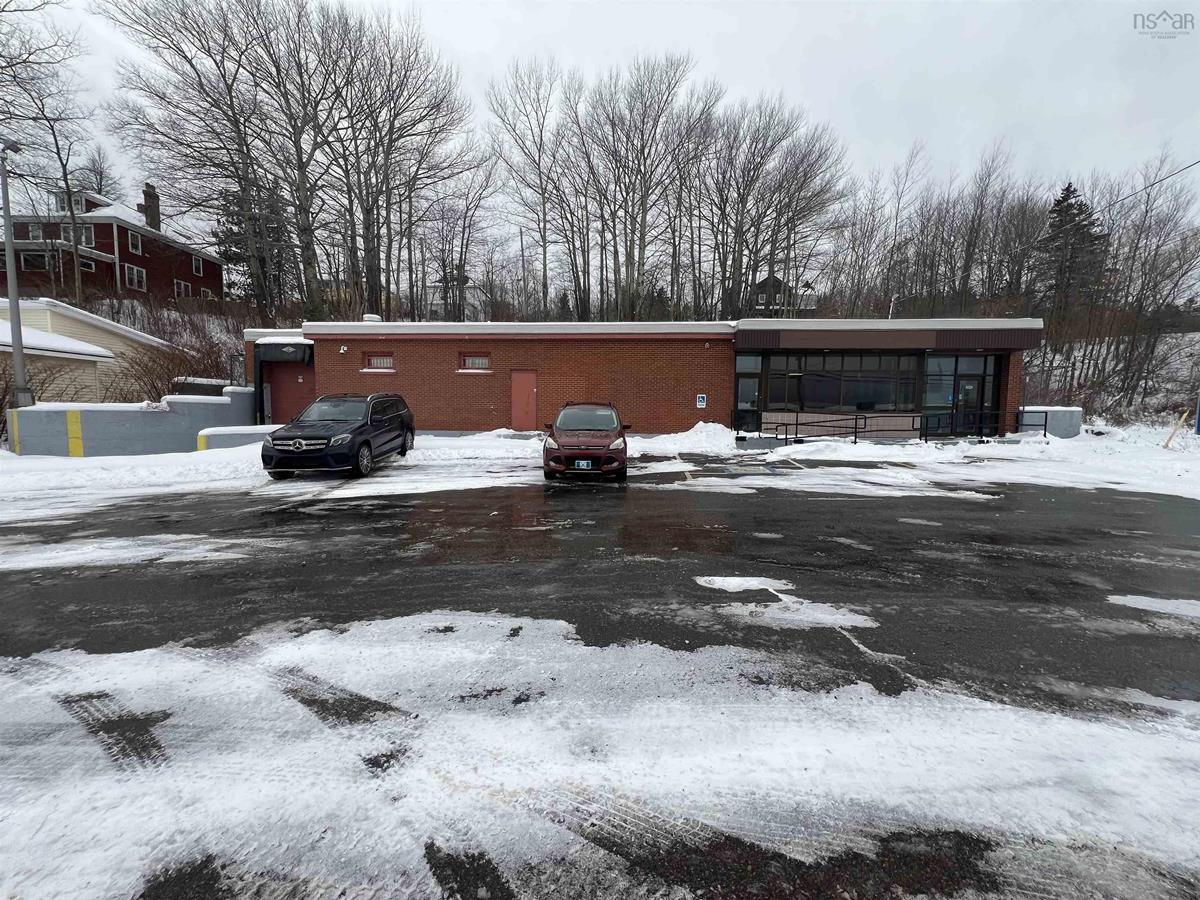
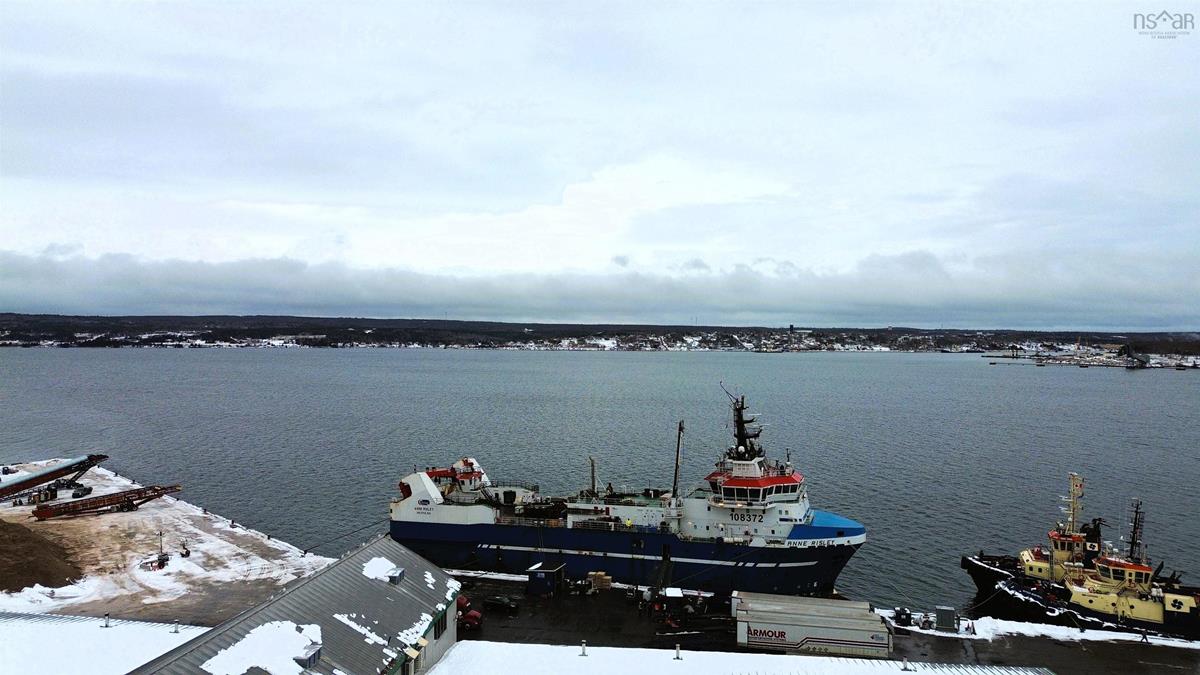
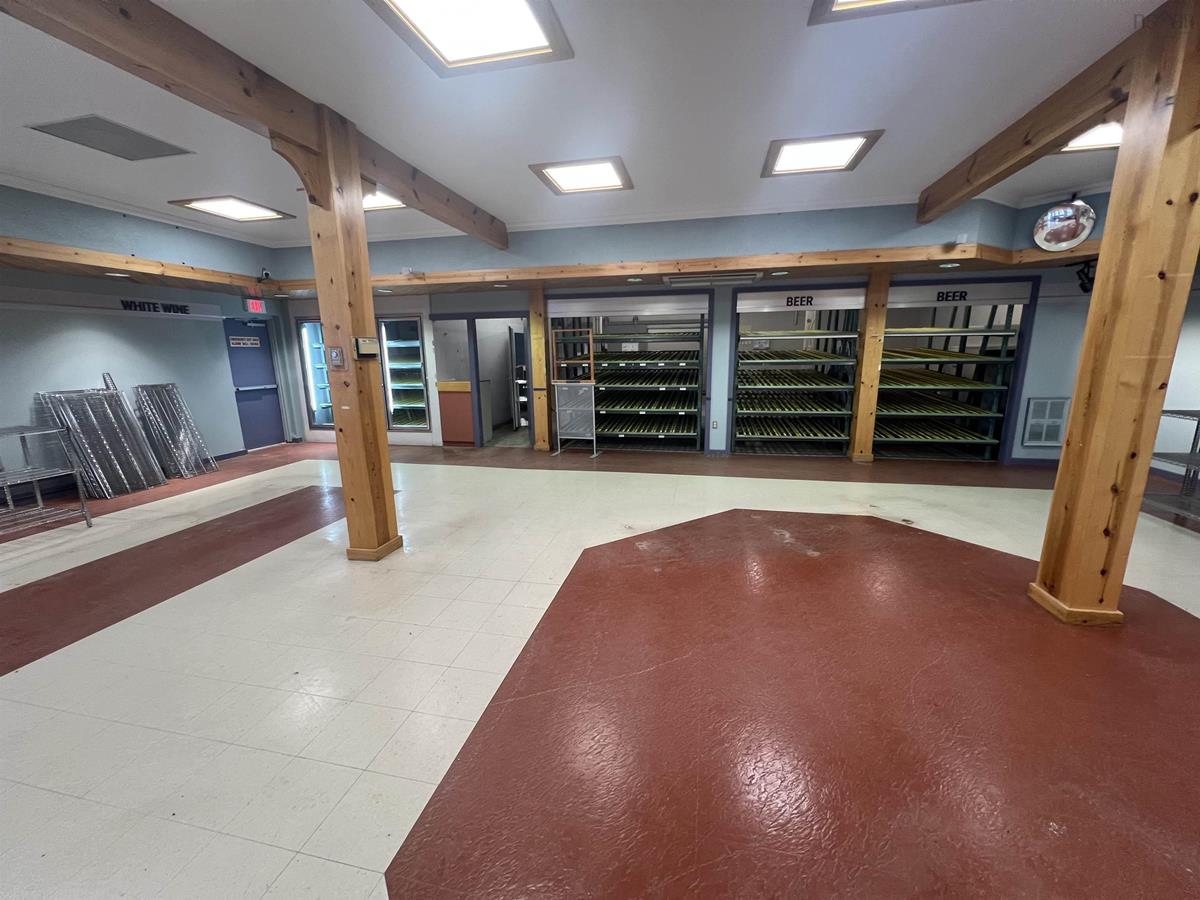
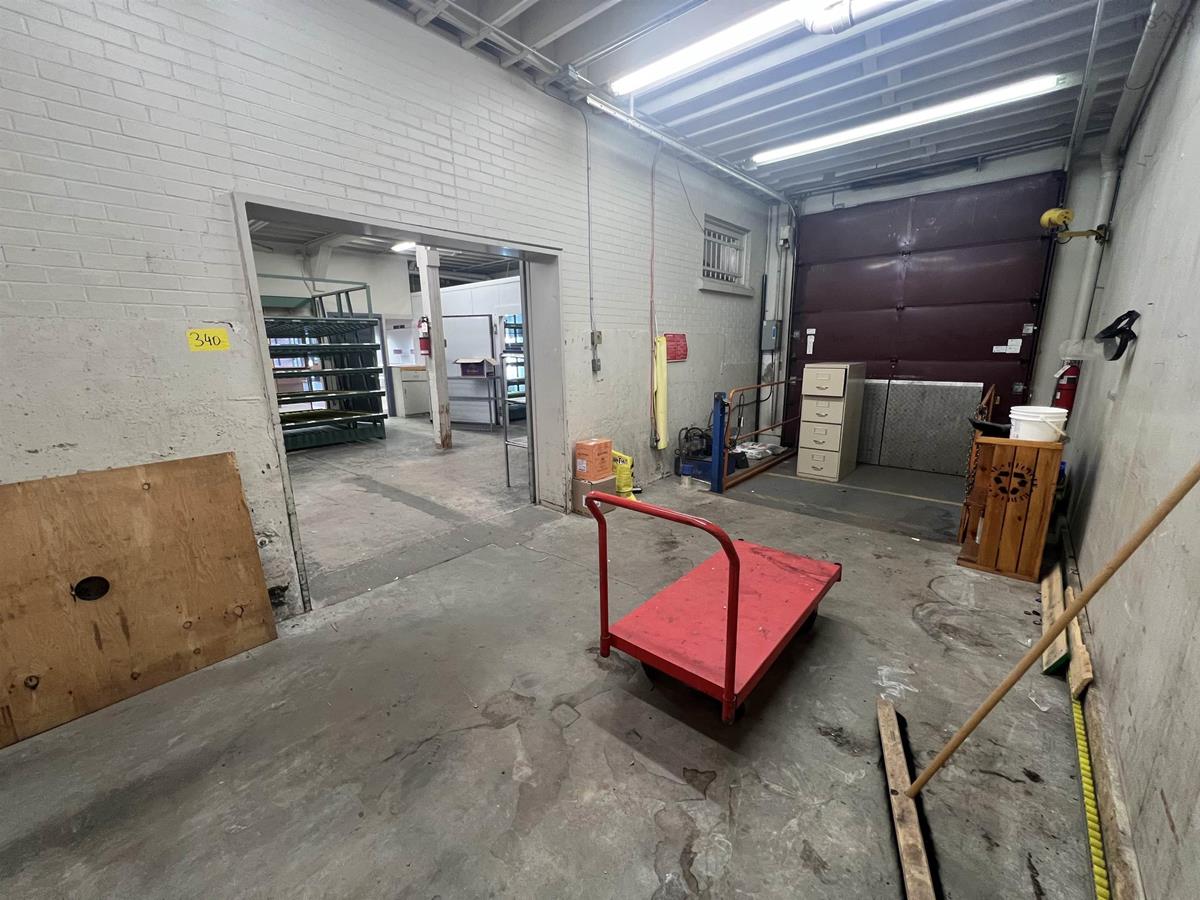
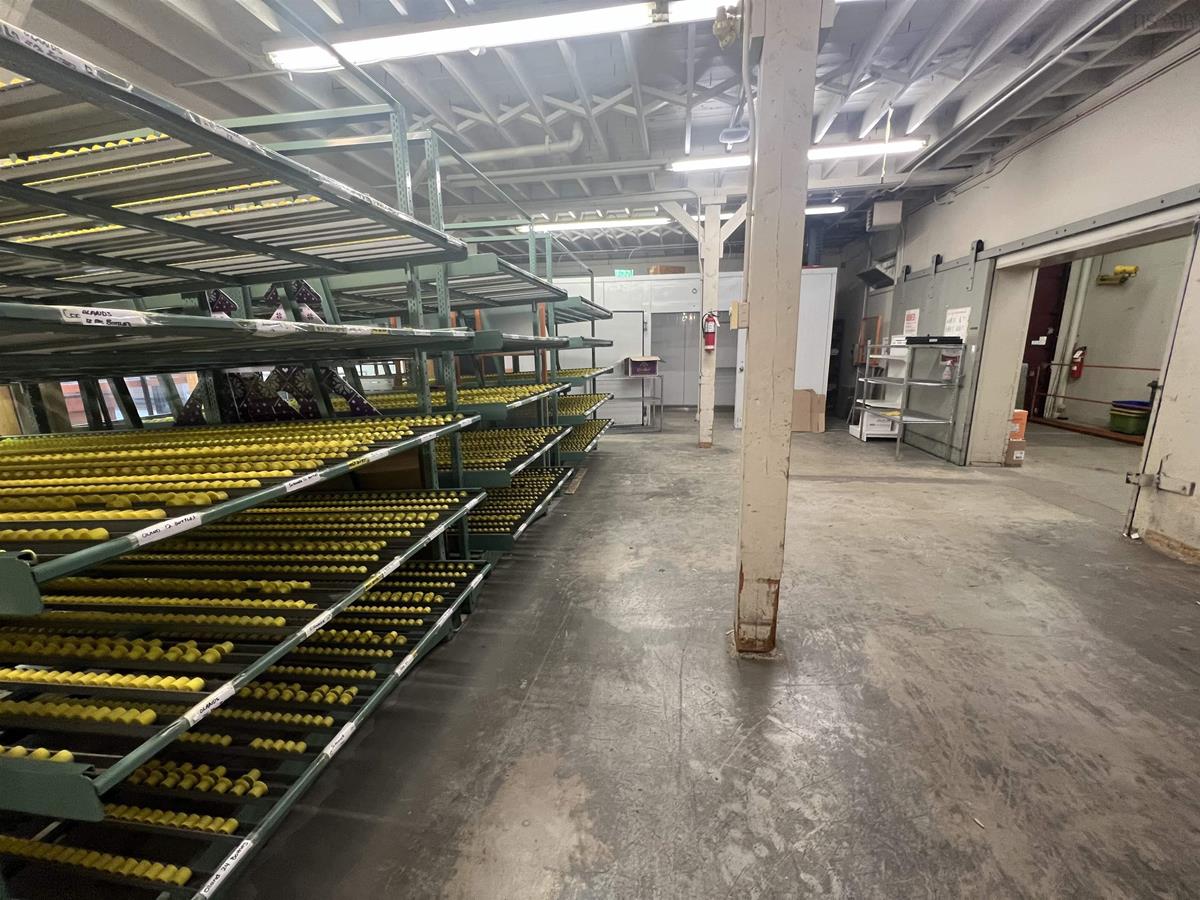
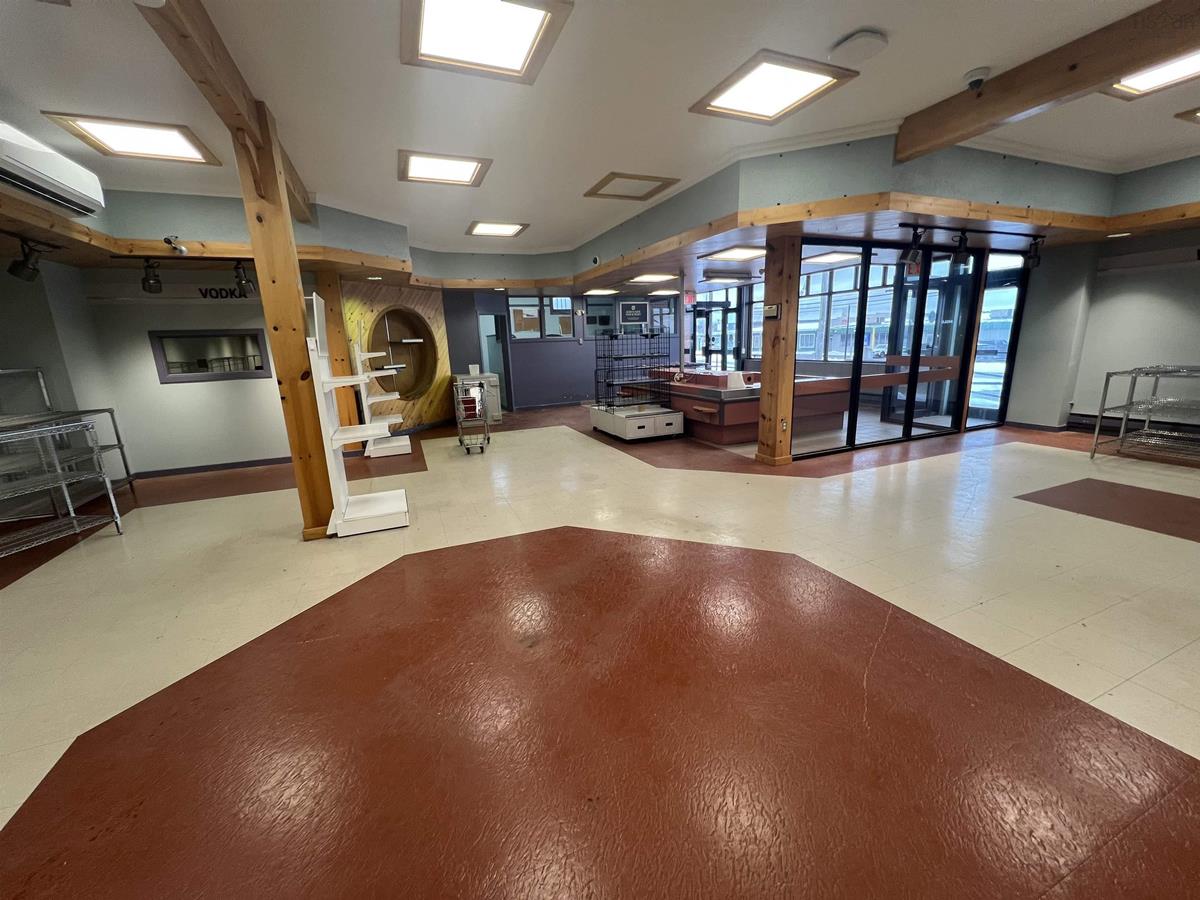
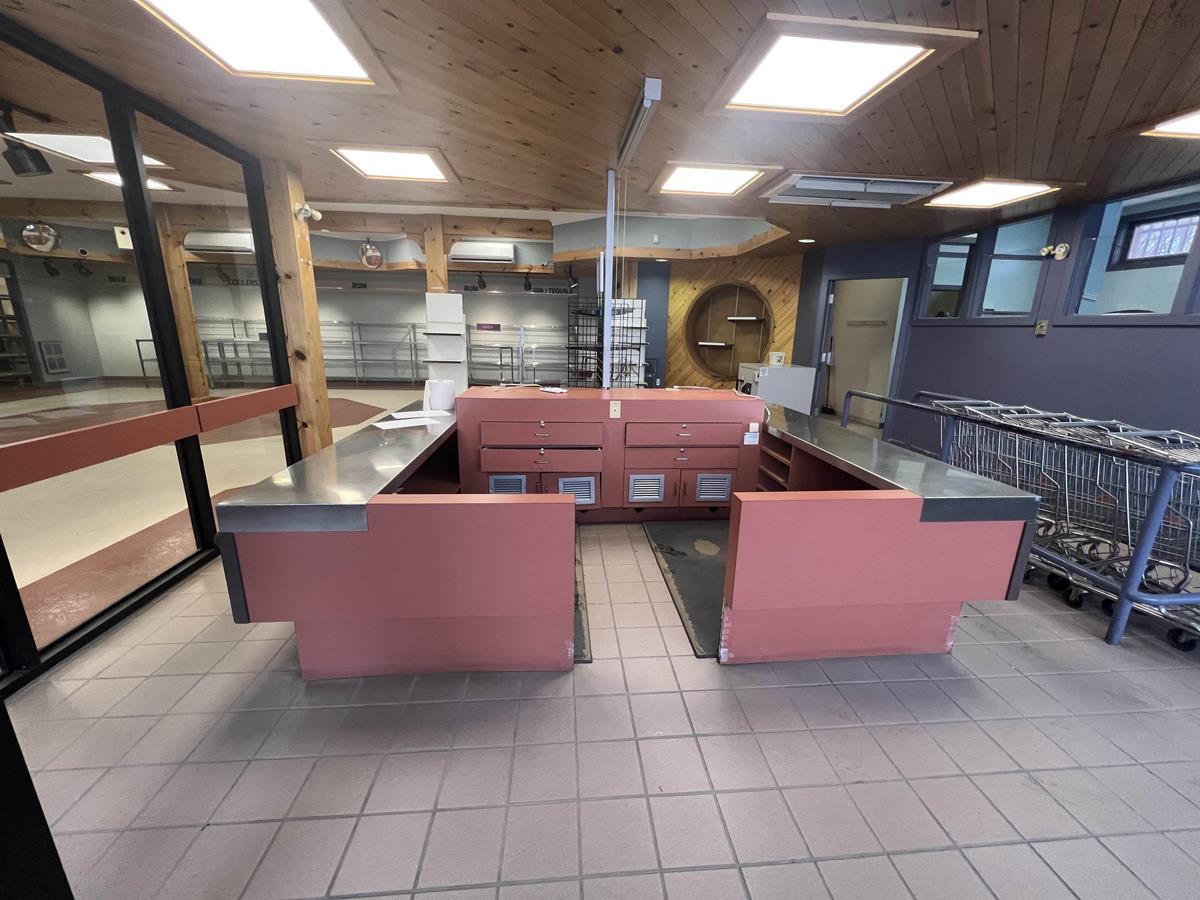
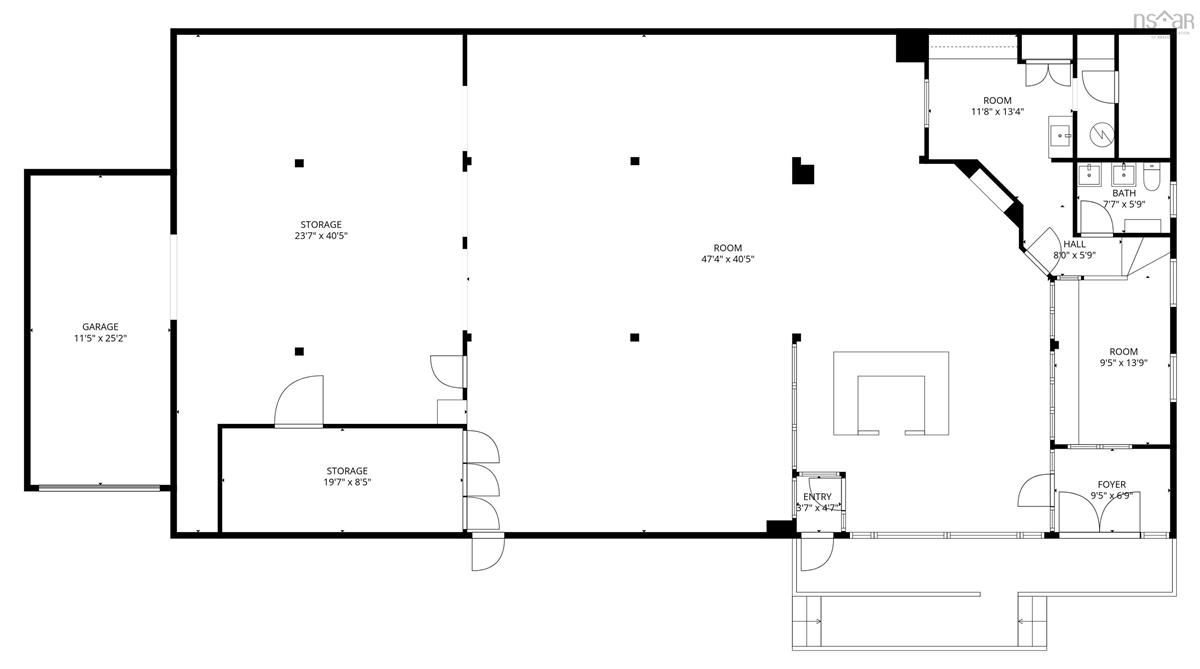
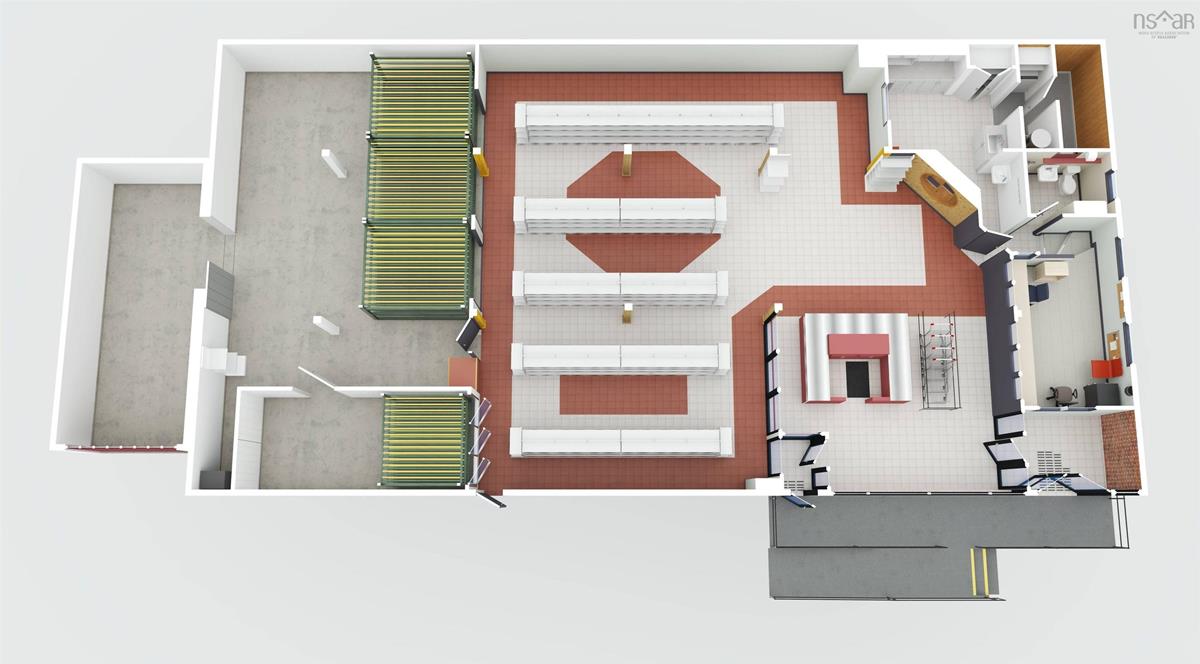
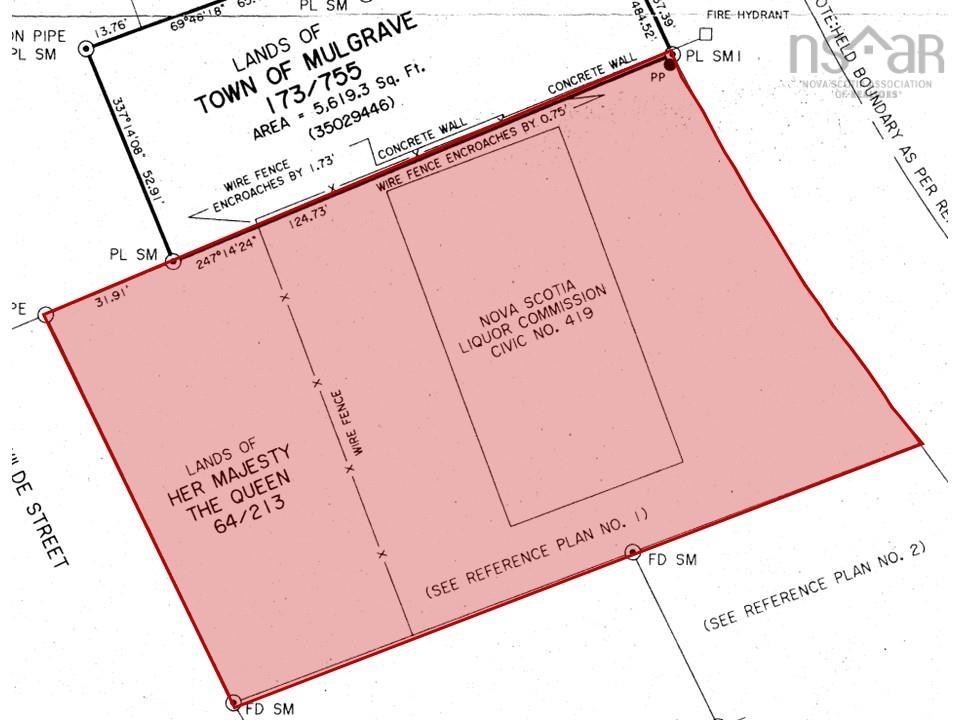
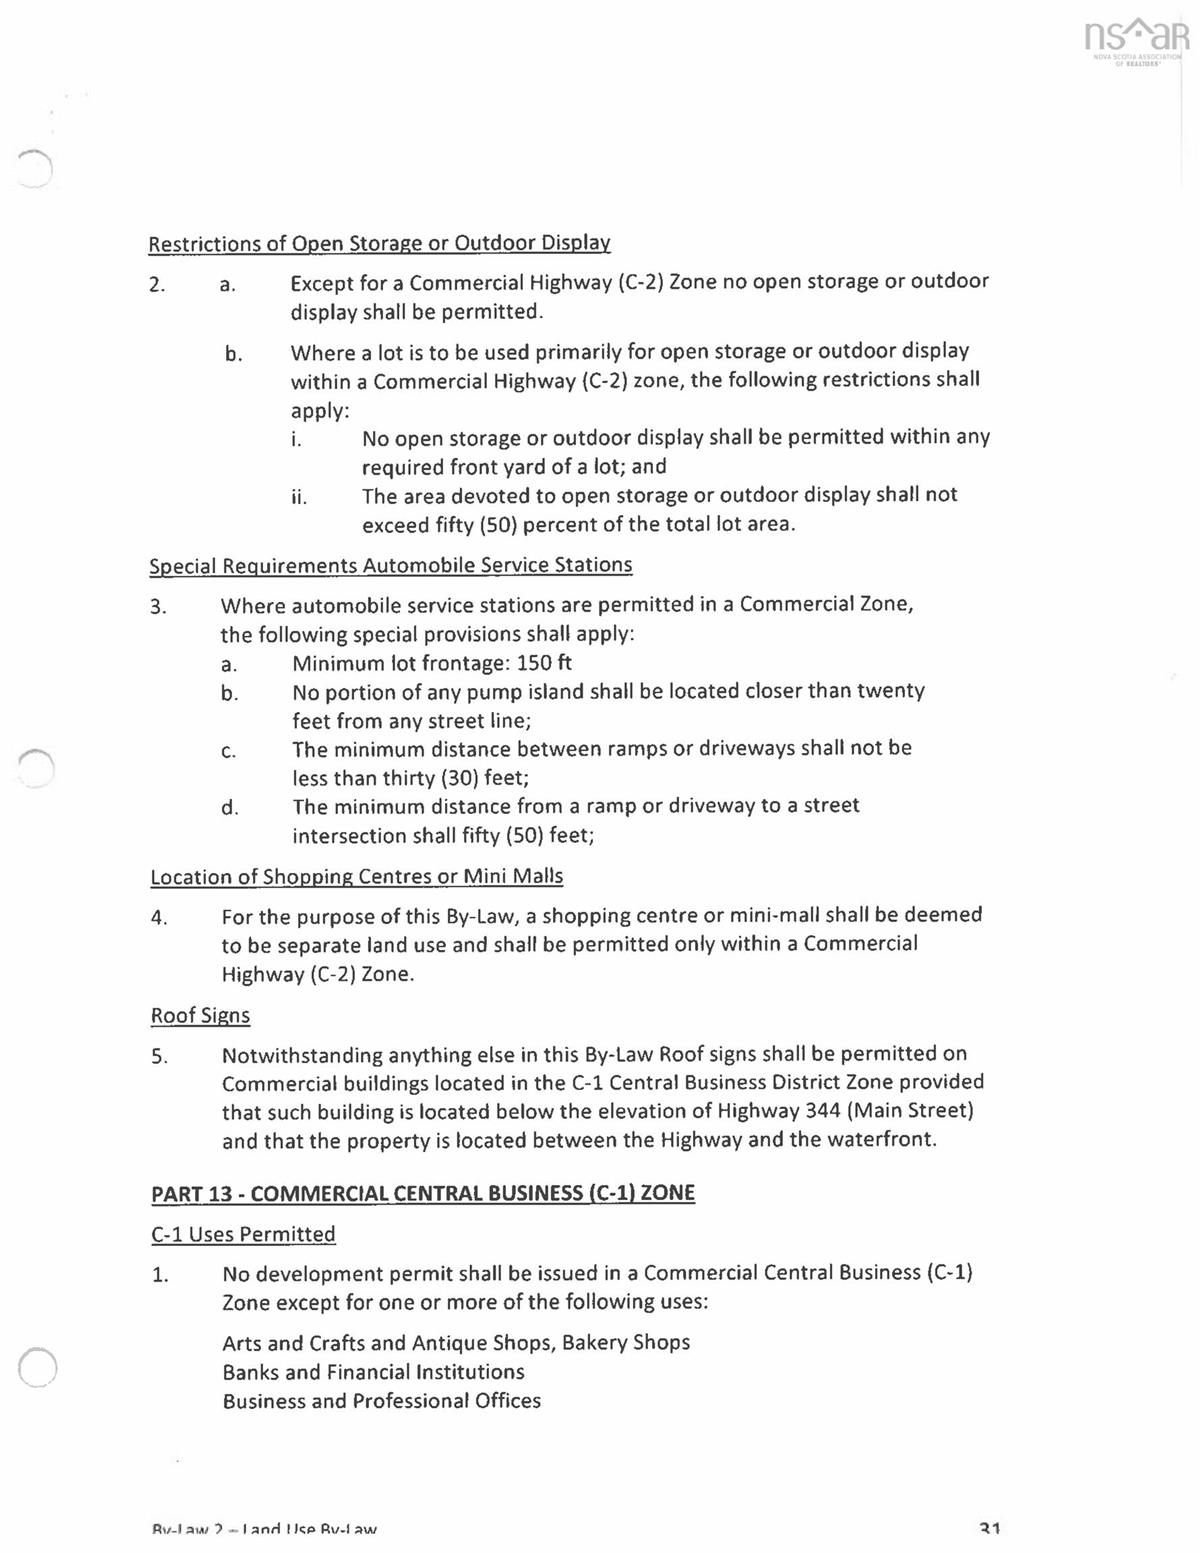
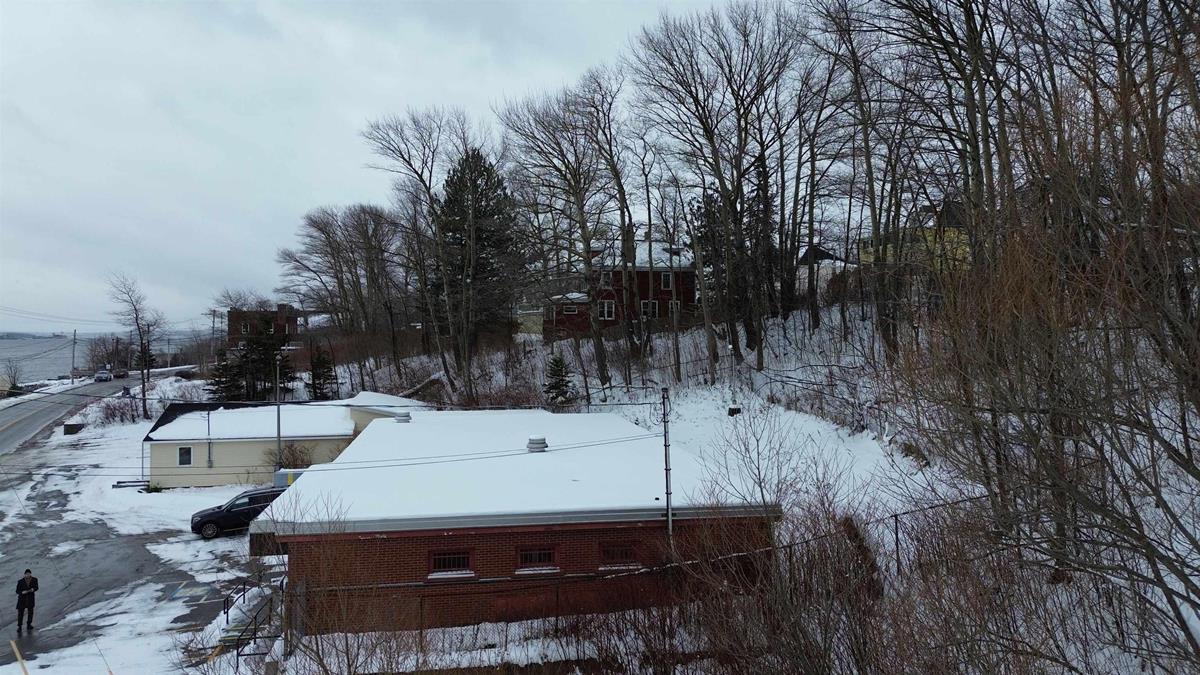
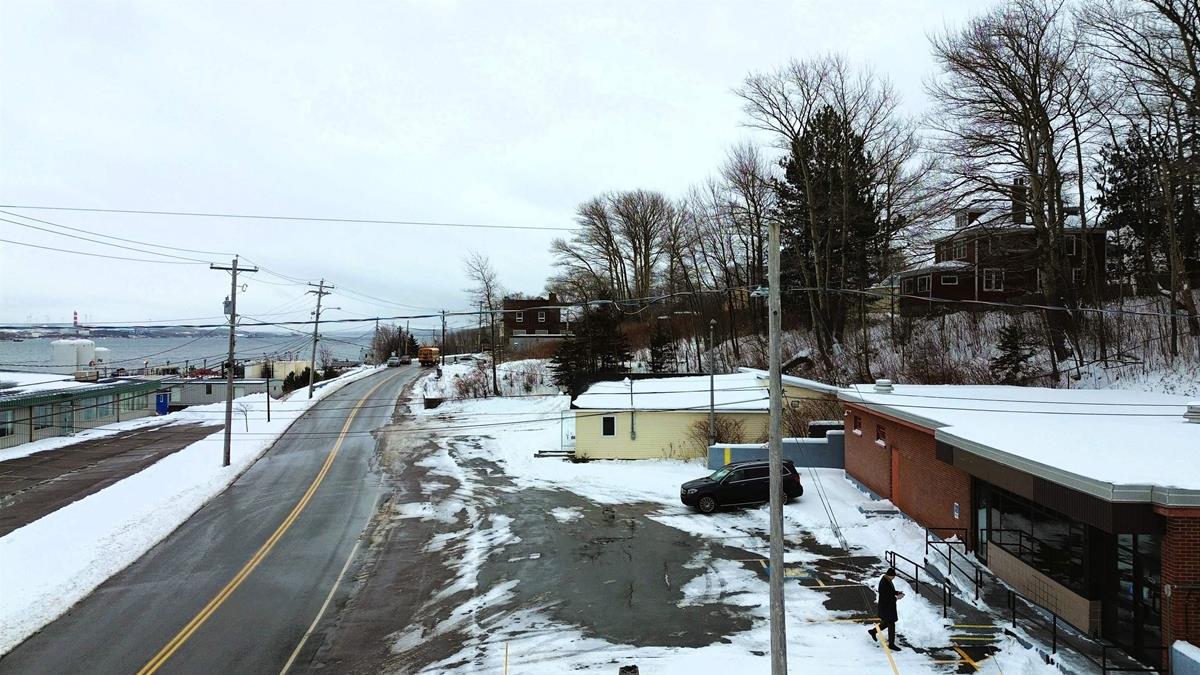
Well-maintained , versatile commercial building For Lease with Dock Height Loading, 3,687 SF. Net rent $11.00/SF; CAM & taxes $5.00/SF(Per square foot per year) Formerly operated as an NSLC retail store. the property features a functional layout including two vestibules, pay till area, two large retail display spaces, a 156 SF walk-in cooler, raised observation area, washroom with janitor closet, lunch room, and 10' x 8' dock level loading and hydraulic dock leveler. Zoned C1 - Commercial Central Business, the property is ideally suited for retail, service, warehouse or office uses, benefiting from high visibility on Main Street (Highway 344) in this historic Strait of Canso community. The property provides access to local and regional thoroughfares, including direct proximity to the Canso Causeway, which connects mainland Nova Scotia to Cape Breton Island.

Listing Details

Address
419 Main Street, Mulgrave, B0E 2G0

Status
ACTIVE
Listing Price
$11
MLS®
202628478
Type
n/a
Style
---
Age
41
Square Footage (MLA)
3,687  ft2
Total Fin SqFt (TLA)
3,687  ft2
PID
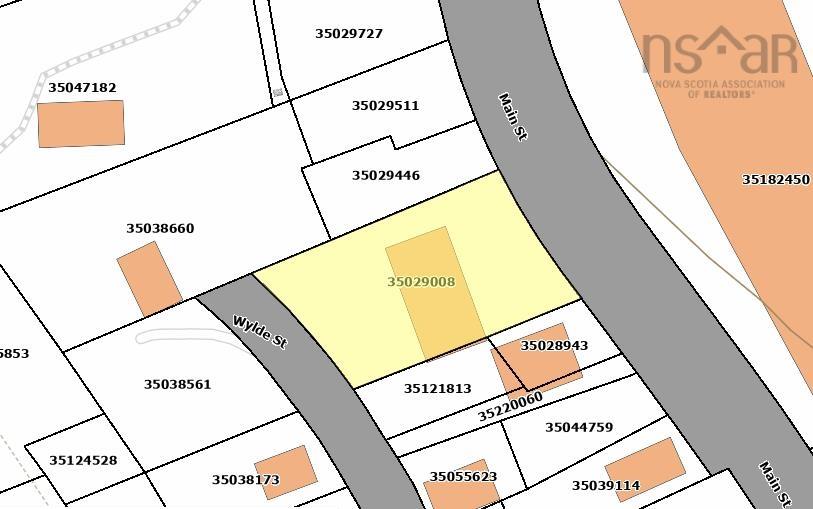
35029008

Water
Municipal
Sewer
---
Utilities
Electrical,Municipal Water,Sewer,Telephone

Building Specifications

Foundation Type
---
Roof
Tar/Gravel
Exterior Finish
---
Flooring
Heavy Loading
RE/MAX Commercial

Garage & Parking

Garage
N
Details
---

Sales History

Demographic Data

Demographic data is based on the dissemination area that contains the listing parcel . Dissemination Areas are small areas composed of one or more neighbouring dissemination blocks. All of Canada is divided into dissemination areas. Data source: Environics Analytics via ArcGIS Online, 2021

Population Size

366

Median Age

55.4

Avg Household Size

2.3

Avg House Income

$90K

The number of people for each age range.

How the population of this area is expected to change.

The highest level of education obtained by people within this area.

The maritial status of the people in this area.

The average household income within this area.

The number of people that rent versus own.

When the buildings in the area were constructed.

The number of children at home for the given age ranges.

The occupations of the people living here.

Tax Assessment

Year Amount % Change
2026 $195,900 ---
2025 $211,900 ---
2024 $231,400 ---
2023 $217,900 ---
2022 $205,800 ---
2021 $216,000 ---
2020 $233,800 ---
2019 $240,400 ---
2018 $253,400 ---
2017 $263,200 ---
2016 $267,600 ---
2015 $272,100 ---
2014 $543,400 ---
2013 $271,400 ---
2012 $279,000 ---

Maps

Last Updated On: 11/21/2026 1:45:21 AM (UTC)