8 SHADY Lane, Mill Lake, (MLS® 202317151) RE/MAX nova
Google Play iOS Google Play iOS Google Play iOS

8 SHADY Lane, Mill Lake

0 0 0 sqft
$28,000 For Sale

Description

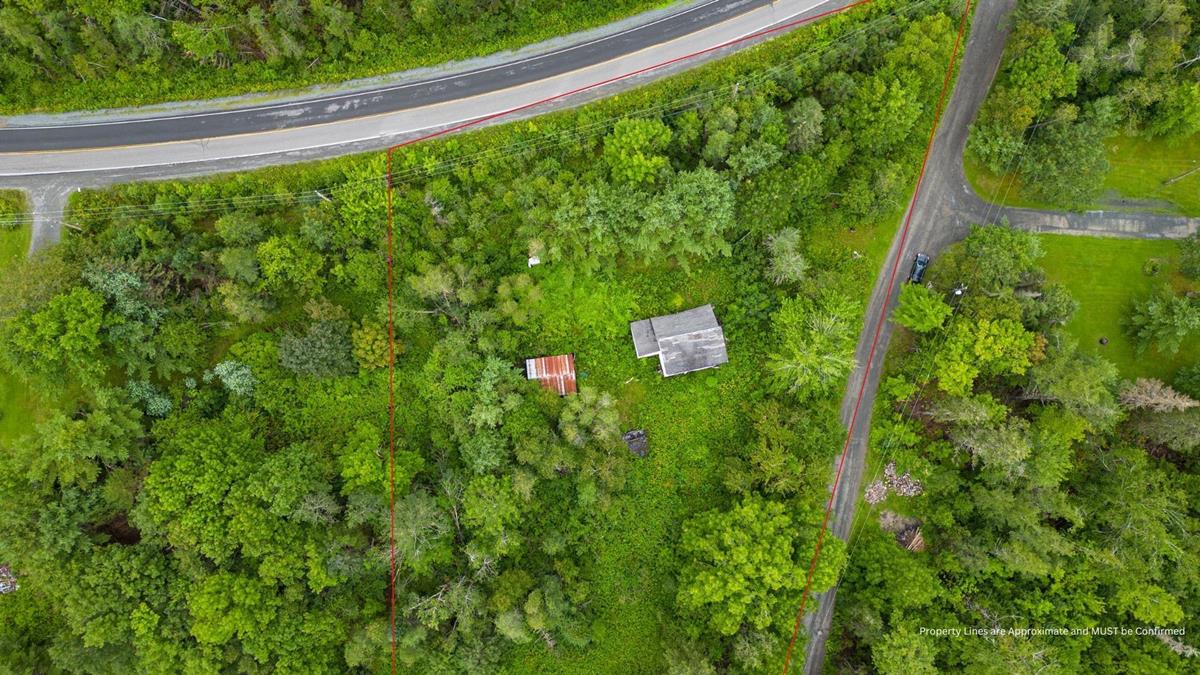
Rural living is calling your name! Take a look at this one-acre piece of land in the community of Mill Lake, 5 minutes outside of Upper Musquodoboit & 15 minutes from Upper Stewiacke. This one-acre piece of land has been sitting vacant for over a decade and it's ready for its new owner to put it back to use! There's a dilapidated home on the property that shouldn't be entered when seeing the land, but if removed the potential is endless on this private piece of property. The end of Shady Lane brings you out to Mill Lake. Come take a look at this land!

Listing Details

Address
8 SHADY Lane, Mill Lake, B0N 2M0

Status
ACTIVE
Listing Price
$28,000
MLS®
202317151
Type
n/a
Style
---
PID
40335879

Water
Drilled Well
Sewer
Septic,To Be Verified
Utilities
Cable,Electricity,Telephone

Building Specifications

Foundation Type
---
Roof
---
Exterior Finish
---
Flooring
---

Looking for a Mortgage? Get Your Free Quote Started Today!

Garage & Parking

Garage
---
Details
---

Sales History

Halifax Regional Municipality Data

Zoning
MU
By-Law Code: 14
By-Law Area
Musquodoboit Valley/Dutch Settlement
By-Law Code: MVDS
Polling District
Waverley - Fall River - Musquodoboit Valley
Concillor: Cathy Deagle Gammon
Waste Collection
TUESDAY
Contractor: Eastern Shore Cartage

Demographic Data

Demographic data is based on the dissemination area that contains the listing parcel . Dissemination Areas are small areas composed of one or more neighbouring dissemination blocks. All of Canada is divided into dissemination areas. Data source: Environics Analytics via ArcGIS Online, 2021

Population Size

547

Median Age

54.6

Avg Household Size

2.2

Avg House Income

$68K

The number of people for each age range.

How the population of this area is expected to change.

The highest level of education obtained by people within this area.

The maritial status of the people in this area.

The average household income within this area.

The number of people that rent versus own.

When the buildings in the area were constructed.

The number of children at home for the given age ranges.

The occupations of the people living here.

Tax Assessment

Year Amount % Change
2023 $120,600 ---
2022 $106,100 ---
2021 $103,600 ---
2020 $102,500 ---
2019 $101,000 ---
2018 $102,600 ---
2017 $103,700 ---
2016 $107,000 ---
2015 $110,800 ---
2014 $110,300 ---
2013 $108,400 ---
2012 $102,100 ---

Maps

Mortgage Inquiries

Last Updated On: 2/14/2024 1:13:57 PM (UTC)