5 CREELMAN Drive, Dartmouth, (MLS® 202325107) RE/MAX nova
Google Play iOS Google Play iOS Google Play iOS

5 CREELMAN Drive, Dartmouth

0 0 0 sqft
$149,900 Pending

Description

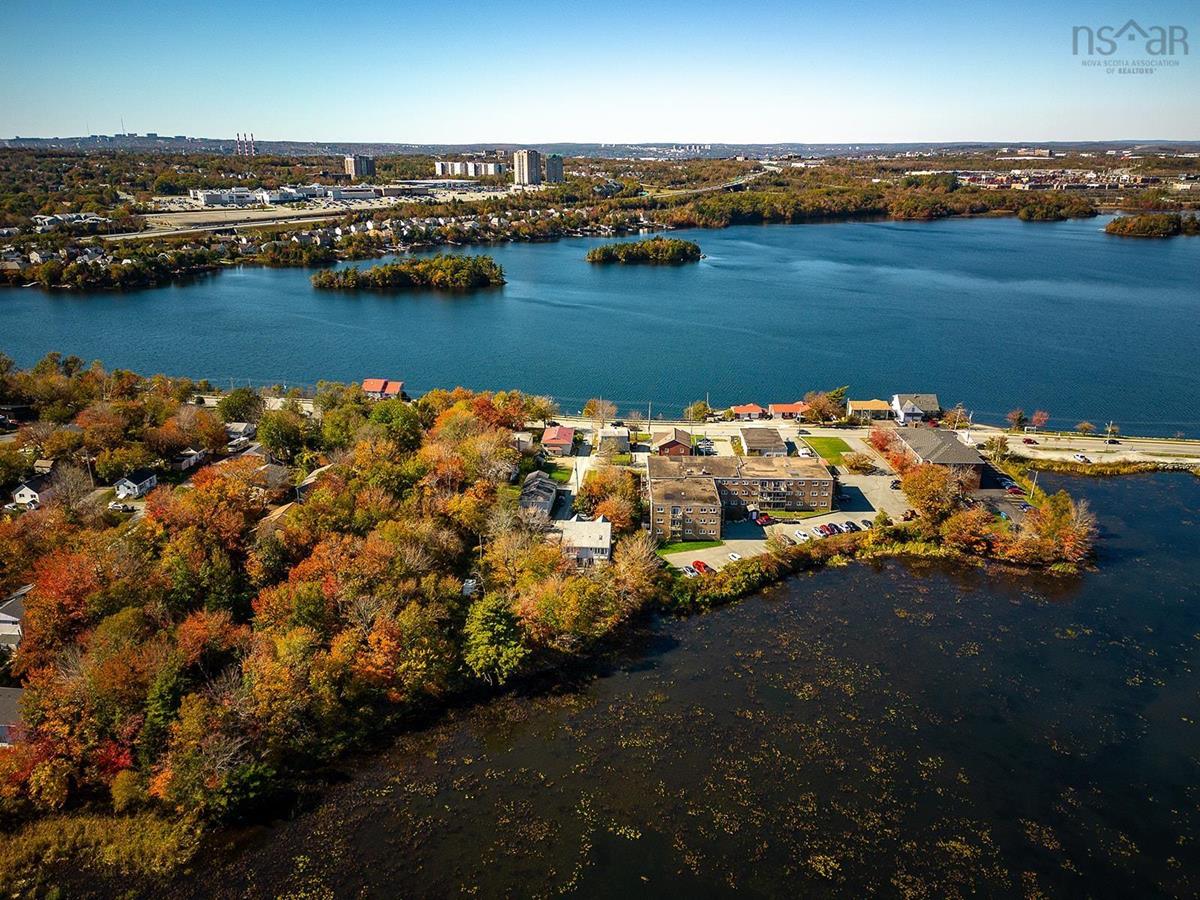
Perched perfectly between Lake Micmac and Red Bridge Pond, let your imagination run wild with the potential provided by this 5087 sqft R3 lot with +/- 112 ft on Creelman Drive in an increasingly sought-after community in Dartmouth. Suited nicely for a duplex, construction could easily yield views of water in all directions and jaw dropping sunsets over Lake Micmac. Perfectly located within walking distance from some of the best that this city has to offer: Lake Banook, Sullivan’s Pond, more parks than we can list, Micmac Bar and Grill, Nine Locks Brewing Company, the amenities provided by Braemar Drive and Waverley, as well as the hustle, bustle, dining and shopping offered by Downtown Dartmouth. With building lots being in high demand and attractive zoning, 5 Creelman Drive provides an exciting investment opportunity.

Listing Details

Address
5 CREELMAN Drive, Dartmouth, B2X 2T3

Status
PENDING
Listing Price
$149,900
MLS®
202325107
Type
n/a
Style
---
PID
40610644

Water
None
Sewer
None
Utilities
None

Building Specifications

Foundation Type
---
Roof
---
Exterior Finish
---
Flooring
---

Looking for a Mortgage? Get Your Free Quote Started Today!

Garage & Parking

Garage
---
Details
---

Sales History

Halifax Regional Municipality Data

Zoning
R-3
By-Law Code: 4
By-Law Area
Dartmouth
By-Law Code: DART
Polling District
Harbourview - Burnside - Dartmouth East
Concillor: Tony Mancini
Waste Collection
WEDNESDAY
Contractor: REgroup

Demographic Data

Demographic data is based on the dissemination area that contains the listing parcel . Dissemination Areas are small areas composed of one or more neighbouring dissemination blocks. All of Canada is divided into dissemination areas. Data source: Environics Analytics via ArcGIS Online, 2021

Population Size

747

Median Age

40.7

Avg Household Size

2.2

Avg House Income

$85K

The number of people for each age range.

How the population of this area is expected to change.

The highest level of education obtained by people within this area.

The maritial status of the people in this area.

The average household income within this area.

The number of people that rent versus own.

When the buildings in the area were constructed.

The number of children at home for the given age ranges.

The occupations of the people living here.

Tax Assessment

Year Amount % Change
2023 $141,100 ---
2022 $82,000 ---
2021 $75,000 ---
2020 $75,000 ---
2019 $74,900 ---
2018 $74,900 ---
2017 $74,800 ---
2016 $74,800 ---
2015 $74,500 ---
2014 $74,400 ---
2013 $74,300 ---
2012 $59,300 ---

Maps

Mortgage Inquiries

Last Updated On: 4/4/2024 8:40:07 PM (UTC)