5264 Highway 289, Upper Stewiacke, (MLS® 202402469) RE/MAX nova
Google Play iOS Google Play iOS Google Play iOS

5264 Highway 289, Upper Stewiacke

2 1 1100 sqft
Sold

Description

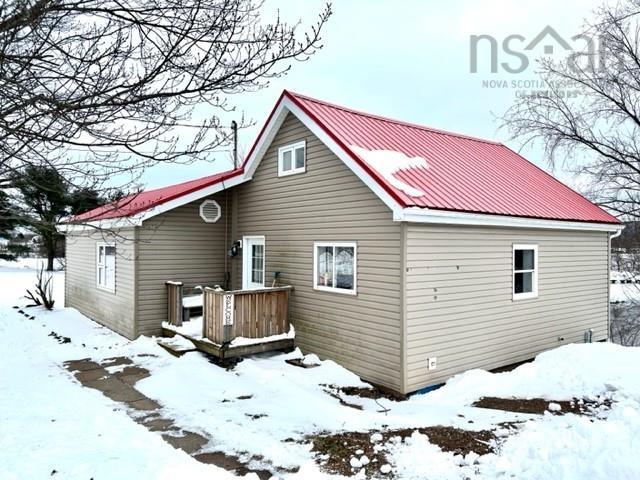
Imagine waking up to a stunning view of the Stewiacke River and enjoying a morning coffee on a large deck overlooking the beautiful country side. Just steps from the Stewiacke River you'll find a cozy 2 bedroom 1.5 storey 1 bath home with a detached 1.5 car garage. Main floor offers an eat-in kitchen, large living room, primary bedroom and 4 piece bath. Second level a loft/bedroom. Upgrades such as septic system 2023, heat pump, eaves-troughs, electrical upgrade in garage, water heater 2023. The lot is large enough for growing your own vegetables, raise small livestock, minutes to Co-op/gas station, elementary school and post office. 20 minutes to Brookfield.

Listing Details

Address
5264 Highway 289, Upper Stewiacke, B0N 2P0

Status
SOLD
Sold Price
Log In
MLS®
202402469
Type
Single Family
Style
Detached
Age
77
Square Footage (MLA)
1,100  ft2
Total Fin SqFt (TLA)
1,100  ft2
PID
20053096
Bedrooms
2
Full Baths
1
Half Baths
0

Water
Well
Sewer
Septic
Utilities
Electricity,High Speed Internet,Telephone

Building Specifications

Foundation Type
Poured Concrete,Other
Roof
Metal
Exterior Finish
Vinyl
Flooring
Laminate

Looking for a Mortgage? Get Your Free Quote Started Today!

Rooms

LEVEL TYPE DIMENSIONS
Main Floor Eat In Kitchen 18.8 X 13.6
Main Floor Living Room 23 X 14.6
Main Floor Bedroom 9.2 X 10.6
Main Floor Bath 1 7.11 X 9.2 -Jog
2nd Level Bedroom 12.10 X 22.9 -Jog

Garage & Parking

Garage
Y
Details
Detached, 1.5 garage.

Sales History

Demographic Data

Demographic data is based on the dissemination area that contains the listing parcel . Dissemination Areas are small areas composed of one or more neighbouring dissemination blocks. All of Canada is divided into dissemination areas. Data source: Environics Analytics via ArcGIS Online, 2021

Population Size

352

Median Age

51.7

Avg Household Size

2.3

Avg House Income

$87K

The number of people for each age range.

How the population of this area is expected to change.

The highest level of education obtained by people within this area.

The maritial status of the people in this area.

The average household income within this area.

The number of people that rent versus own.

When the buildings in the area were constructed.

The number of children at home for the given age ranges.

The occupations of the people living here.

Tax Assessment

Year Amount % Change
2024 $118,500 ---
2023 $97,400 ---
2022 $81,600 ---
2021 $64,200 ---
2020 $63,700 ---
2019 $58,800 ---
2018 $58,100 ---
2017 $57,400 ---
2016 $56,100 ---
2015 $56,000 ---
2014 $111,600 ---
2013 $53,500 ---
2012 $49,400 ---

Maps

Mortgage Inquiries

Last Updated On: 4/23/2024 12:00:00 AM (UTC)