68 castle Drive, Sydney, (MLS® 202408184) RE/MAX nova
Google Play iOS Google Play iOS Google Play iOS

68 castle Drive, Sydney

3 1 1000 sqft
$204,500 Pending

Description

THIS 2 BEDROOM ON MAIN FLOOR PLUS 1 BEDROOM IN LOFT UPSTAIRS MAKES FOR A GREAT HOME. SOME HARDWOOD CERAMIC AND LAMINATE FLOORING and some newer paint and light fixtures kitchen taps etc. plus a 24x24 detached garage mancave in back no axcess for car but great for entertaining heat pump in garage EVCHARGER ON SIDE OF HOME TO PLUG CAR RV ETC IN

Listing Details

Address
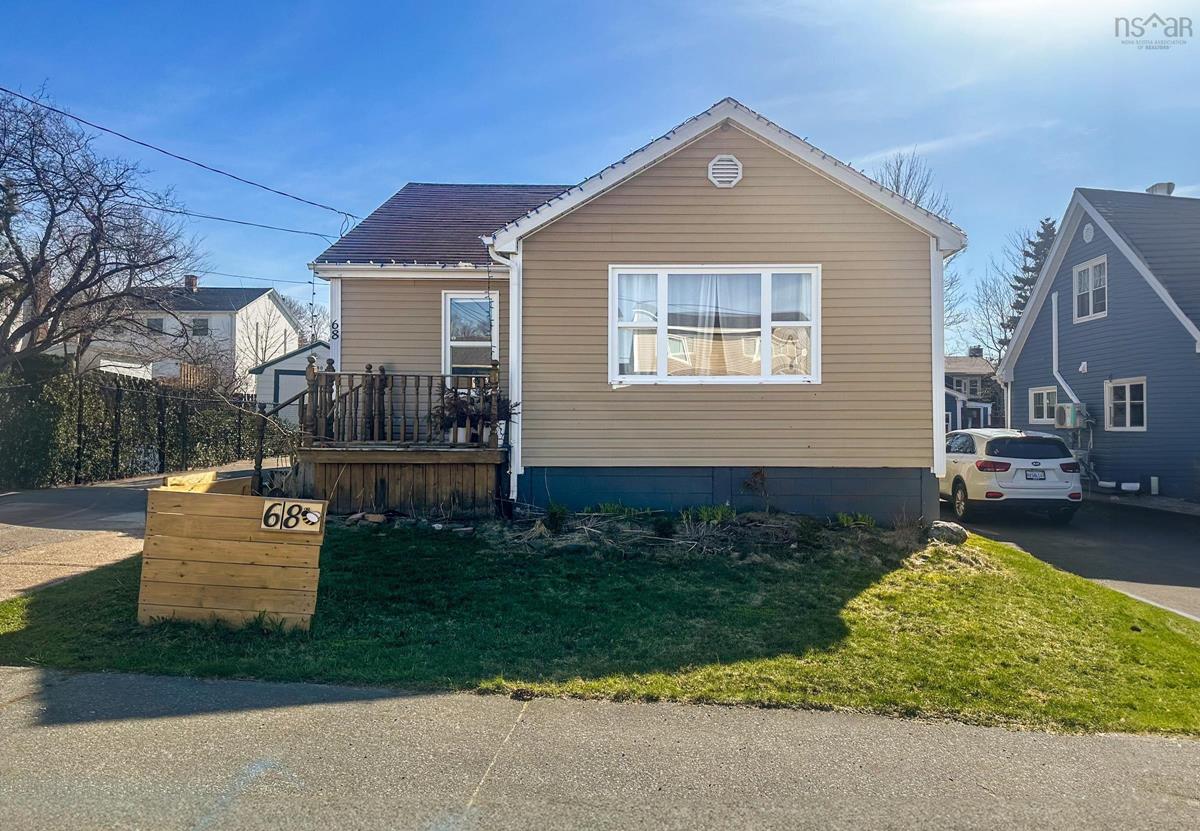
68 castle Drive, Sydney, B1S 2A4

Status
PENDING
Listing Price
$204,500
MLS®
202408184
Type
Single Family
Style
Detached
Age
66
Square Footage (MLA)
900  ft2
Total Fin SqFt (TLA)
1,000  ft2
PID
15081185
Bedrooms
3
Full Baths
1
Half Baths
0

Water
Municipal
Sewer
Municipal
Utilities
Cable,Electricity,High Speed Internet,Telephone

Building Specifications

Foundation Type
Poured Concrete
Roof
Asphalt Shingle
Exterior Finish
Vinyl
Flooring
Ceramic,Hardwood,Laminate

Looking for a Mortgage? Get Your Free Quote Started Today!

Rooms

LEVEL TYPE DIMENSIONS
Main Floor Bath 1 4PC
Main Floor Bedroom 9.8X7.9
Main Floor Primary Bedroom 11X8.6
Main Floor Living Room 11X19
Main Floor Eat In Kitchen 11X9
2nd Level OTHER 13X24 LOW ATTIC

Garage & Parking

Garage
Y
Details
24X24

Inclusions & Exclusions

Inclusions
5 APPLIANCES

Sales History

Demographic Data

Demographic data is based on the dissemination area that contains the listing parcel . Dissemination Areas are small areas composed of one or more neighbouring dissemination blocks. All of Canada is divided into dissemination areas. Data source: Environics Analytics via ArcGIS Online, 2021

Population Size

464

Median Age

56.1

Avg Household Size

1.8

Avg House Income

$88K

The number of people for each age range.

How the population of this area is expected to change.

The highest level of education obtained by people within this area.

The maritial status of the people in this area.

The average household income within this area.

The number of people that rent versus own.

When the buildings in the area were constructed.

The number of children at home for the given age ranges.

The occupations of the people living here.

Tax Assessment

Year Amount % Change
2024 $151,100 ---
2023 $137,600 ---
2022 $130,200 ---
2021 $125,700 ---
2020 $123,300 ---
2019 $122,600 ---
2018 $119,100 ---
2017 $116,600 ---
2016 $115,400 ---
2015 $111,900 ---
2014 $220,200 ---
2013 $108,200 ---
2012 $105,600 ---

Maps

Mortgage Inquiries

Last Updated On: 5/2/2024 7:56:13 PM (UTC)