19 Kent Court, Sydney Forks, (MLS® 202316485) RE/MAX nova
Google Play iOS Google Play iOS Google Play iOS

19 Kent Court, Sydney Forks

6 4 3017 sqft
Sold

Description

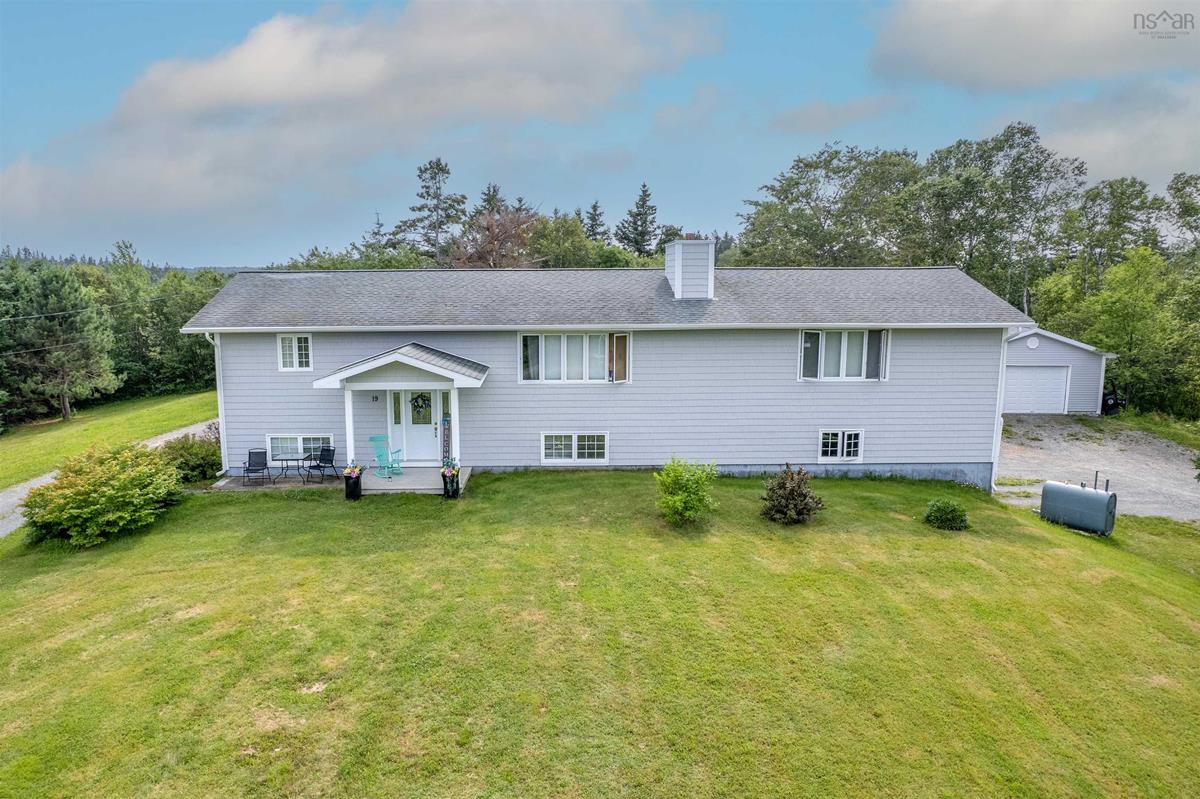
Welcome to 19 Kent court! This 6 bed room family home is situated in a highly desirable area with over an acre of land for the children to play. The upstairs offers 4 generous bedrooms a Large eat in kitchen and spacious living room. Down stairs includes a 2 bedroom unit that can be used as extra living space or extra income! This home comes with an attached 2 bay garage , a pool and a detached garage. Call to book your showing today!

Listing Details

Address
19 Kent Court, Sydney Forks, B1L 1C1

Status
SOLD
Sold Price
Log In
MLS®
202316485
Type
Single Family
Style
Detached
Age
49
Square Footage (MLA)
1,750  ft2
Total Fin SqFt (TLA)
3,017  ft2
PID
15620370
Bedrooms
6
Full Baths
3
Half Baths
1

Water
Drilled Well
Sewer
Septic
Utilities
Cable,Electricity,High Speed Internet,Telephone

Building Specifications

Foundation Type
Poured Concrete
Roof
Asphalt Shingle
Exterior Finish
Vinyl
Flooring
Ceramic,Laminate,Linoleum

Looking for a Mortgage? Get Your Free Quote Started Today!

Rooms

LEVEL TYPE DIMENSIONS
Basement Kitchen 10x15
Basement Bath 3 4pc
Basement Living Room 12x15
Basement Bedroom 10x10
Basement Bedroom 8.5X13
Basement Laundry 6.5X10
Main Floor Eat In Kitchen 11x24
Main Floor Living Room 13.4x19
Main Floor Primary Bedroom 11.5x17
Main Floor Bedroom 10x14.5
Main Floor Bedroom 9.3x13.5
Main Floor Bedroom 10x14
Main Floor Laundry 5.5x8
Main Floor Bath 1 3pc
Main Floor Bath 1 4pc

Garage & Parking

Garage
Y
Details
wired

Sales History

Demographic Data

Demographic data is based on the dissemination area that contains the listing parcel . Dissemination Areas are small areas composed of one or more neighbouring dissemination blocks. All of Canada is divided into dissemination areas. Data source: Environics Analytics via ArcGIS Online, 2021

Population Size

605

Median Age

49.8

Avg Household Size

2.4

Avg House Income

$115K

The number of people for each age range.

How the population of this area is expected to change.

The highest level of education obtained by people within this area.

The maritial status of the people in this area.

The average household income within this area.

The number of people that rent versus own.

When the buildings in the area were constructed.

The number of children at home for the given age ranges.

The occupations of the people living here.

Tax Assessment

Year Amount % Change
2024 $356,300 ---
2023 $334,500 ---
2022 $294,000 ---
2021 $288,800 ---
2020 $287,400 ---
2019 $284,300 ---
2018 $277,200 ---
2017 $270,600 ---
2016 $254,400 ---
2015 $251,500 ---
2014 $361,600 ---
2013 $175,300 ---
2012 $162,000 ---

Maps

Mortgage Inquiries

Last Updated On: 4/30/2024 10:50:00 PM (UTC)