283 Main Shore Road, South Chegoggin, (MLS® 202406011) RE/MAX nova
Google Play iOS Google Play iOS Google Play iOS

283 Main Shore Road, South Chegoggin

3 1 1074 sqft
$259,900 For Sale

Description

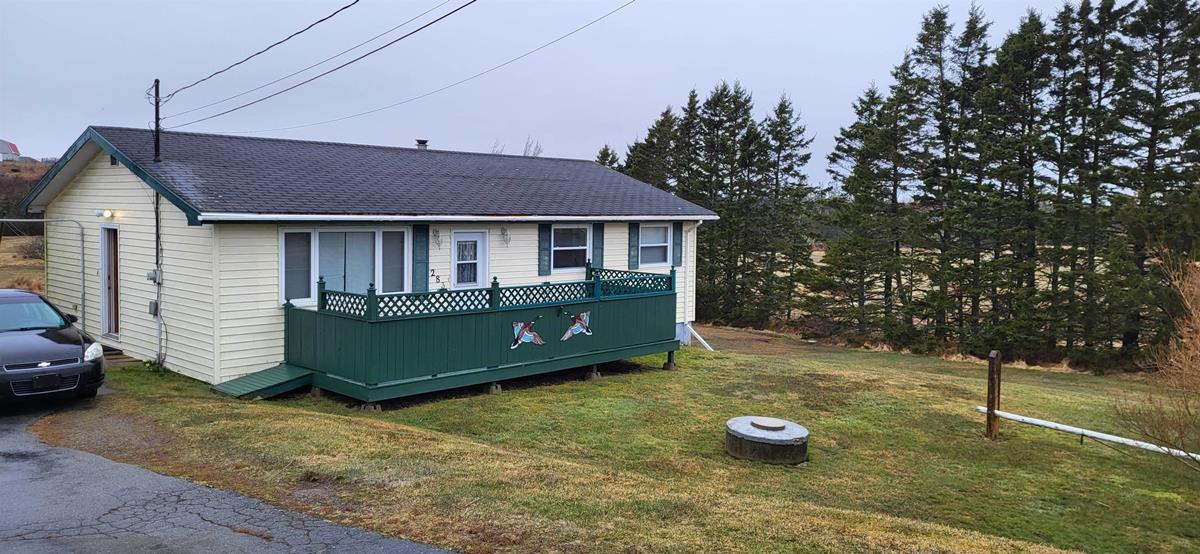
This well constructed 3 bedroom bungalow is looking for a new owner! The home features good size bedrooms, full basement which offers a family room and a walkout entrance to the side yard from the basement. Plenty of room for a growing family. Newer windows have been installed. There is a single car garage with paved driveway and a shed behind the garage. The property has been surveyed. This home is located 1.3km +- past Yarmouth Regional Hospital. Call to book your viewing today.

Listing Details

Address
283 Main Shore Road, South Chegoggin, B5A 5H1

Status
ACTIVE
Listing Price
$259,900
MLS®
202406011
Type
Single Family
Style
Detached
Square Footage (MLA)
1,074  ft2
Total Fin SqFt (TLA)
1,074  ft2
PID
90171885
Bedrooms
3
Full Baths
1
Half Baths
0

Water
Dug,Well
Sewer
Septic
Utilities
Cable,Electricity,High Speed Internet,Telephone

Building Specifications

Foundation Type
Poured Concrete
Roof
Asphalt Shingle
Exterior Finish
---
Flooring
Laminate

Looking for a Mortgage? Get Your Free Quote Started Today!

Rooms

LEVEL TYPE DIMENSIONS
Basement Rec Room 23'2" x 11'5"
Main Floor Kitchen 18.1 x 9.8
Main Floor Living Room 18 x 12
Main Floor Bedroom 13.7 x 9.3
Main Floor Bedroom 11.10 x 9.2
Main Floor Bedroom 12.2 x 9.4
Main Floor Bath 1 9.3 x 7

Garage & Parking

Garage
Y
Details
18 x 20 single car, cement floor, wired, roof reshingled about 4 years ago +-.

Sales History

Demographic Data

Demographic data is based on the dissemination area that contains the listing parcel . Dissemination Areas are small areas composed of one or more neighbouring dissemination blocks. All of Canada is divided into dissemination areas. Data source: Environics Analytics via ArcGIS Online, 2021

Population Size

428

Median Age

53.3

Avg Household Size

2.2

Avg House Income

$85K

The number of people for each age range.

How the population of this area is expected to change.

The highest level of education obtained by people within this area.

The maritial status of the people in this area.

The average household income within this area.

The number of people that rent versus own.

When the buildings in the area were constructed.

The number of children at home for the given age ranges.

The occupations of the people living here.

Tax Assessment

Year Amount % Change
2023 $130,200 ---
2022 $114,500 ---
2021 $110,800 ---
2020 $110,900 ---
2019 $113,100 ---
2018 $113,900 ---
2017 $114,800 ---
2016 $117,000 ---
2015 $123,300 ---
2014 $247,200 ---
2013 $125,900 ---
2012 $131,300 ---

Maps

Mortgage Inquiries

Last Updated On: 4/3/2024 5:21:25 PM (UTC)