1343 Main Shore Road, Sandford, (MLS® 202401996) RE/MAX nova
Google Play iOS Google Play iOS Google Play iOS

1343 Main Shore Road, Sandford

3 1 1198 sqft
Sold

Description

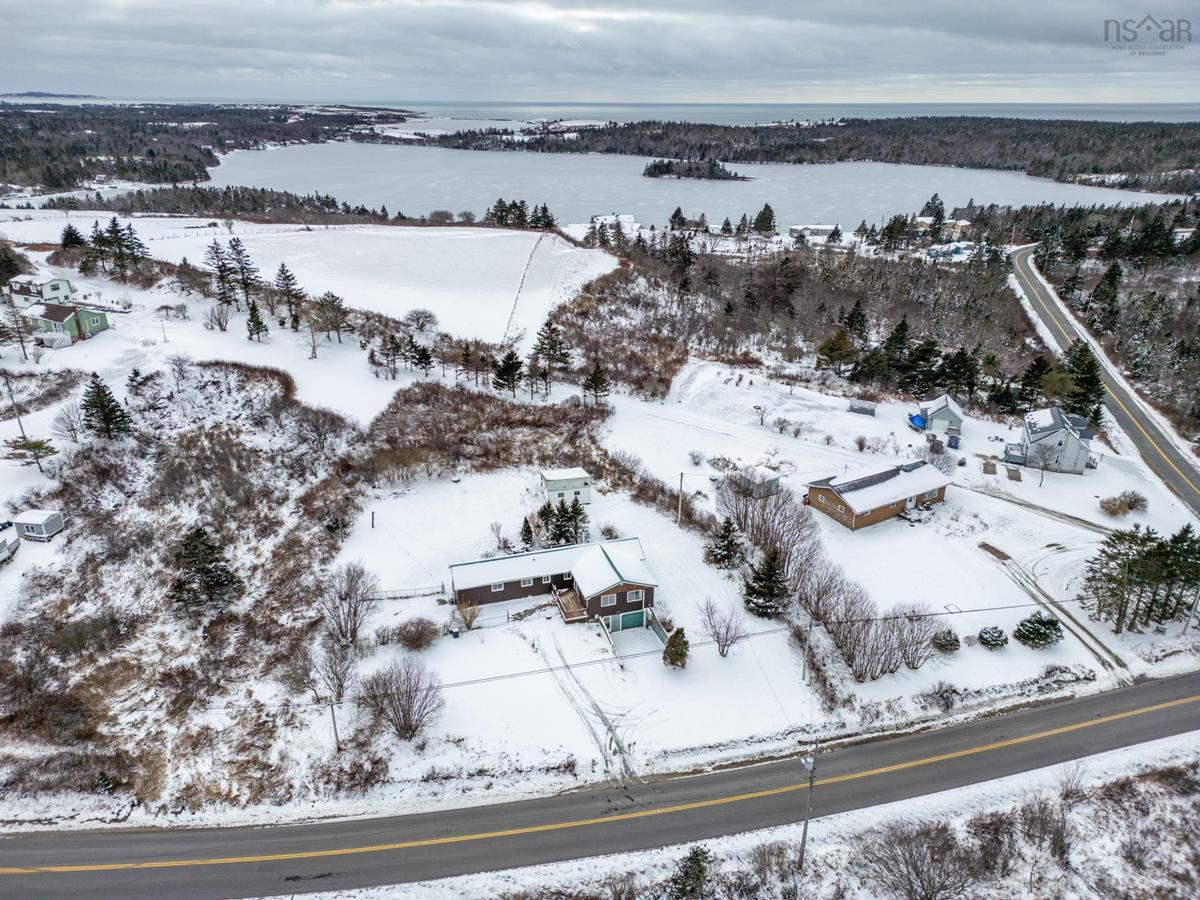
3 bedroom home perched up on a hill in Sandford with great views! Features a metal roof and a fenced in yard for your little ones! 22' x 22' barn (with a little work would make a great space for your hobbies). Drive in basement garage! Large deck. Sunshine flows through this family home. Heated with electric heat, wood stove, heat pump. Lots of storage. Close to beaches and also Yarmouth hospital.

Listing Details

Address
1343 Main Shore Road, Sandford, B5A 5K9

Status
SOLD
Sold Price
Log In
MLS®
202401996
Type
Single Family
Style
Detached
Age
48
Square Footage (MLA)
1,198  ft2
Total Fin SqFt (TLA)
1,198  ft2
PID
90164690
Bedrooms
3
Full Baths
1
Half Baths
0

Water
Dug
Sewer
Septic
Utilities
Cable,Electricity,High Speed Internet,Telephone

Building Specifications

Foundation Type
Block Concrete,Poured Concrete
Roof
Metal
Exterior Finish
Wood Siding
Flooring
Laminate,Vinyl

Looking for a Mortgage? Get Your Free Quote Started Today!

Rooms

LEVEL TYPE DIMENSIONS
Main Floor Mud Room 6' x 10'2" + 7'4" x 6'
Main Floor Kitchen 13'5" x 13'7"
Main Floor Dining Room 16' x 13'5"
Main Floor Living Room 18'9" x 13'
Main Floor OTHER 7'9" x 5'5"+2'8" x 11'+6'9"
Main Floor Bath 1 7'8" x 7'8"
Main Floor Bedroom 10'5" x 7'8"
Main Floor Bedroom 8'5" x 9'
Main Floor Primary Bedroom 13'5" x 9'3"

Garage & Parking

Garage
N
Details
Attached lower level wired

Inclusions & Exclusions

Inclusions
f/s/w/d wood stove

Sales History

Demographic Data

Demographic data is based on the dissemination area that contains the listing parcel . Dissemination Areas are small areas composed of one or more neighbouring dissemination blocks. All of Canada is divided into dissemination areas. Data source: Environics Analytics via ArcGIS Online, 2021

Population Size

516

Median Age

50.4

Avg Household Size

2.1

Avg House Income

$77K

The number of people for each age range.

How the population of this area is expected to change.

The highest level of education obtained by people within this area.

The maritial status of the people in this area.

The average household income within this area.

The number of people that rent versus own.

When the buildings in the area were constructed.

The number of children at home for the given age ranges.

The occupations of the people living here.

Tax Assessment

Year Amount % Change
2023 $111,100 ---
2022 $97,000 ---
2021 $89,500 ---
2020 $88,600 ---
2019 $87,200 ---
2018 $85,600 ---
2017 $84,000 ---
2016 $89,000 ---
2015 $89,100 ---
2014 $182,400 ---
2013 $90,600 ---
2012 $90,000 ---

Maps

Mortgage Inquiries

Last Updated On: 4/2/2024 12:00:00 AM (UTC)