1103 Highway 311, North River, (MLS® 202321420) RE/MAX nova
Google Play iOS Google Play iOS Google Play iOS

1103 Highway 311, North River

0 0 996 sqft
$39,900 Pending

Description

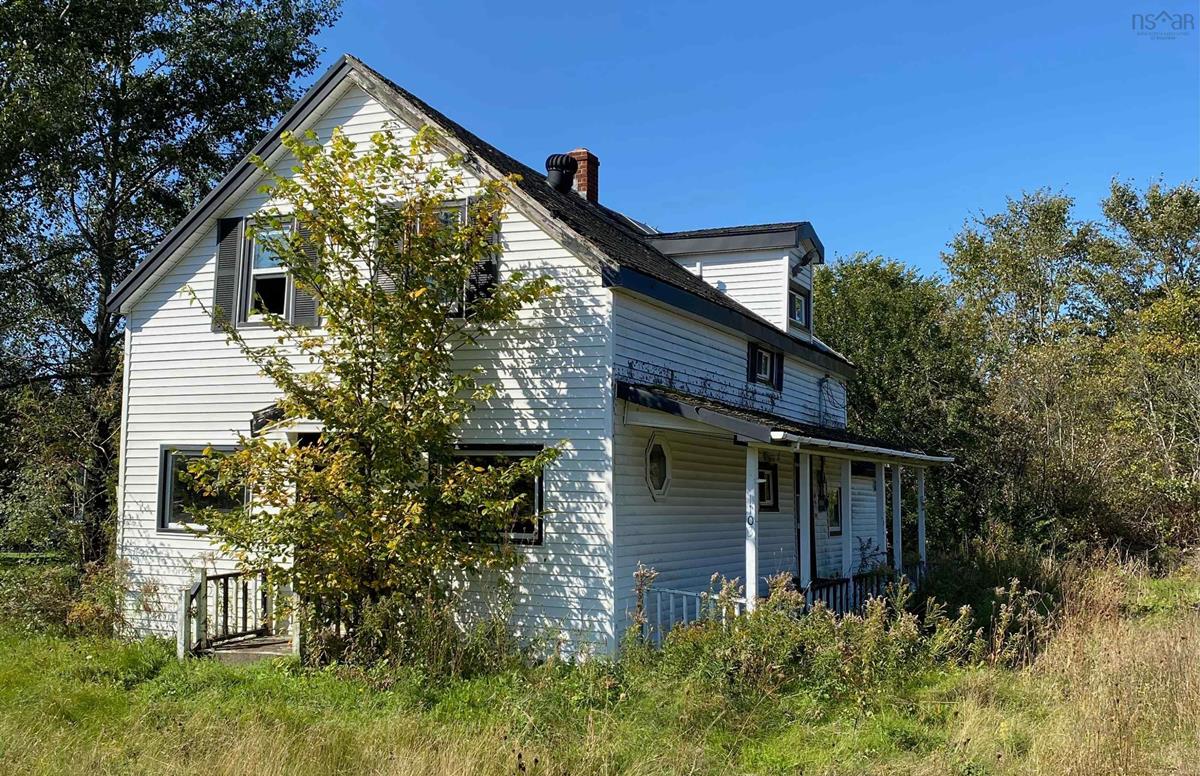
This property is in need of a lot of repairs. It is being sold 'as is, where is'. There is an easement for NS Power. Unable to verify what is under the house. Land value only. Home is not safe to enter. No access is authorized. Priced to sell. It's the listing agents understanding this area is in E-1 zone/RG zone. The property will be subject to development officer approval for any required permits. No new structures will be permitted in E-1 flow way zone. Buyers are to refer to land us bylaw with Colchester to understand the E-1 zone requirements. Call to view today.

Listing Details

Address
1103 Highway 311, North River, B2N 5B4

Status
PENDING
Listing Price
$39,900
MLS®
202321420
Type
Single Family
Style
Detached
Square Footage (MLA)
996  ft2
Total Fin SqFt (TLA)
996  ft2
PID
20004370
Bedrooms
0
Full Baths
0
Half Baths
0

Water
Well
Sewer
Septic
Utilities
Electricity,High Speed Internet,Telephone

Building Specifications

Foundation Type
Other
Roof
Asphalt Shingle
Exterior Finish
Vinyl
Flooring
None

Looking for a Mortgage? Get Your Free Quote Started Today!

Rooms

LEVEL TYPE DIMENSIONS
Main Floor OTHER -
Main Floor OTHER -
Main Floor OTHER -
Main Floor OTHER -
Main Floor OTHER -

Garage & Parking

Garage
N
Details
---

Sales History

Demographic Data

Demographic data is based on the dissemination area that contains the listing parcel . Dissemination Areas are small areas composed of one or more neighbouring dissemination blocks. All of Canada is divided into dissemination areas. Data source: Environics Analytics via ArcGIS Online, 2021

Population Size

518

Median Age

48.8

Avg Household Size

2.5

Avg House Income

$93K

The number of people for each age range.

How the population of this area is expected to change.

The highest level of education obtained by people within this area.

The maritial status of the people in this area.

The average household income within this area.

The number of people that rent versus own.

When the buildings in the area were constructed.

The number of children at home for the given age ranges.

The occupations of the people living here.

Tax Assessment

Year Amount % Change
2024 $74,200 ---
2023 $64,400 ---
2022 $59,600 ---
2021 $54,600 ---
2020 $54,000 ---
2019 $53,800 ---
2018 $50,100 ---
2017 $48,400 ---
2016 $47,300 ---
2015 $45,500 ---
2014 $90,600 ---
2013 $44,100 ---
2012 $43,600 ---

Maps

Mortgage Inquiries

Last Updated On: 4/15/2024 7:10:56 PM (UTC)