1539 Highway 330, Newellton, (MLS® 202406900) RE/MAX nova
Google Play iOS Google Play iOS Google Play iOS

1539 Highway 330, Newellton

4 1 1862 sqft
$179,900 For Sale

Description

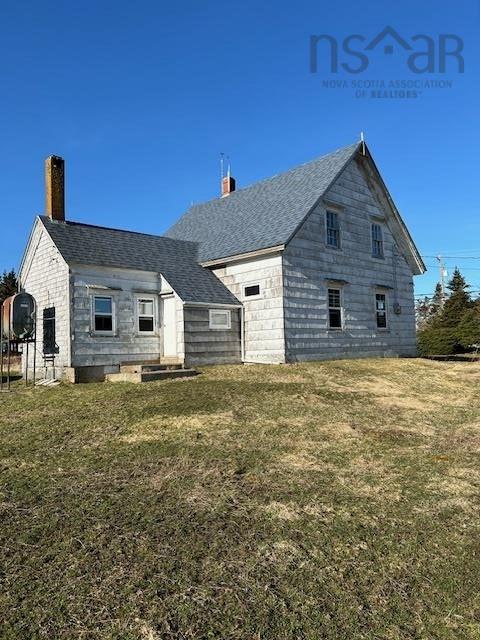
Older four bedroom home situated on 49.35 acres being sold "as is, where is" in the fishing community of Newellton on Cape Sable Island. This home is fairly secluded with a spruce tree hedge giving the property a bit of privacy. Home has four bedrooms (three on main level) Kitchen, living room, and bath also on main level. On second leve; is a large room measuring 15 ft x 20 ft as well as the fourth bedroom. Basemenr is partial (approximately 10 x 12) Roof was re shingled within the last 2-3 years Shed on property measuring 18.6 x 14.3 - some new windows, new water pump, and heater.

Listing Details

Address
1539 Highway 330, Newellton, B0W 2G0

Status
ACTIVE
Listing Price
$179,900
MLS®
202406900
Type
Single Family
Style
Detached
Age
100
Square Footage (MLA)
1,862  ft2
Total Fin SqFt (TLA)
1,862  ft2
PID
80027139
Bedrooms
4
Full Baths
1
Half Baths
0

Water
Dug
Sewer
Septic
Utilities
Cable,Electricity,Telephone

Building Specifications

Foundation Type
Other
Roof
Asphalt Shingle
Exterior Finish
Wood Shingles
Flooring
Carpet

Looking for a Mortgage? Get Your Free Quote Started Today!

Rooms

LEVEL TYPE DIMENSIONS
Main Floor Kitchen 15.5 x 9.5
Main Floor Living Room 17 x 13
Main Floor Bedroom 9.2 x 9
Main Floor Bedroom 13.3 x 11
Main Floor Bedroom 7.2 x 11.4
Main Floor Bath 1 7 x 5
Main Floor Foyer 3.11 x 5.10
2nd Level Bedroom 8.4 x 9
2nd Level OTHER 15 x 20

Garage & Parking

Garage
N
Details
---

Sales History

Demographic Data

Demographic data is based on the dissemination area that contains the listing parcel . Dissemination Areas are small areas composed of one or more neighbouring dissemination blocks. All of Canada is divided into dissemination areas. Data source: Environics Analytics via ArcGIS Online, 2021

Population Size

557

Median Age

48.9

Avg Household Size

2.4

Avg House Income

$98K

The number of people for each age range.

How the population of this area is expected to change.

The highest level of education obtained by people within this area.

The maritial status of the people in this area.

The average household income within this area.

The number of people that rent versus own.

When the buildings in the area were constructed.

The number of children at home for the given age ranges.

The occupations of the people living here.

Tax Assessment

Year Amount % Change
2024 $131,400 ---
2023 $116,900 ---
2022 $108,700 ---
2021 $106,200 ---
2020 $104,400 ---
2019 $102,600 ---
2018 $101,300 ---
2017 $100,700 ---
2016 $96,400 ---
2015 $100,700 ---
2014 $201,800 ---
2013 $101,300 ---
2012 $100,000 ---

Maps

Mortgage Inquiries

Last Updated On: 5/3/2024 1:39:33 PM (UTC)