3136 Mt Carmel Ave Avenue, New Waterford, (MLS® 202405896) RE/MAX nova
Google Play iOS Google Play iOS Google Play iOS

3136 Mt Carmel Ave Avenue, New Waterford

3 1 866 sqft
$219,000 For Sale

Description

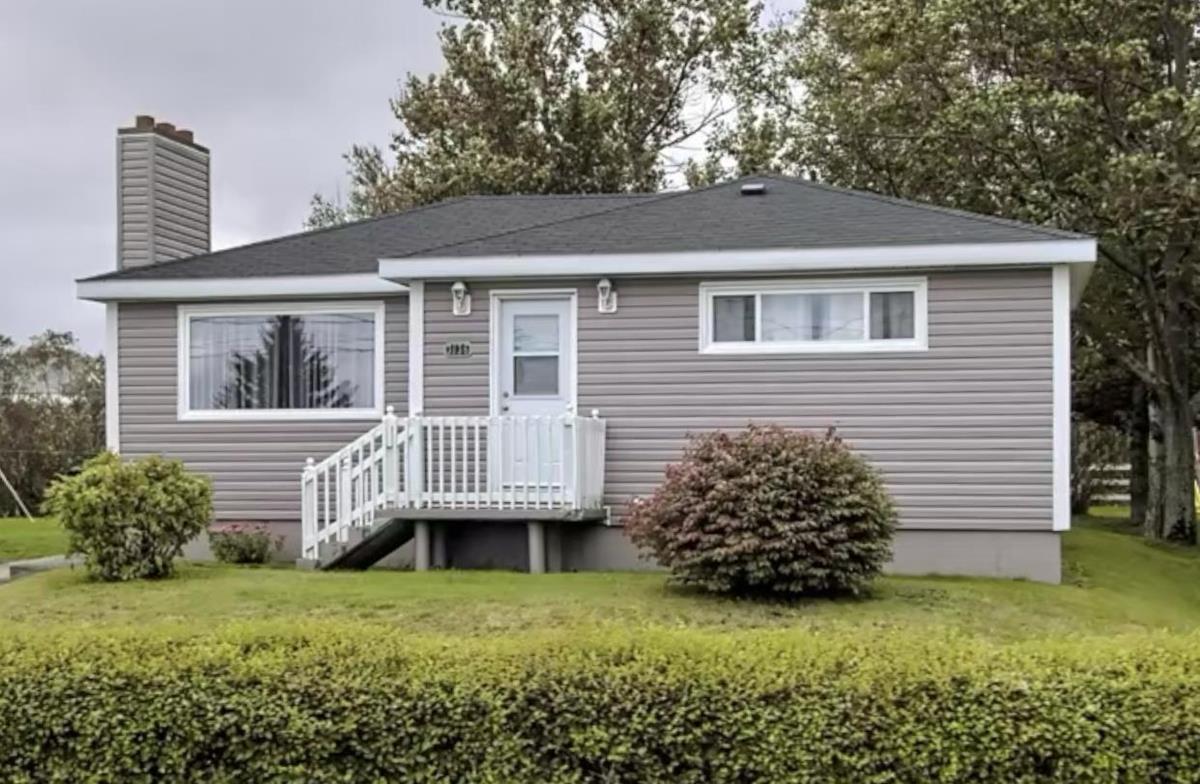
Welcome to 3136 Mt Carmel Ave! This lovely 3 bedroom 1 bathroom bungalow is awaiting it's new owners. The basement is unfinished and is ready to be developed to suit your families needs. Close to all amenities so don't miss out on this sweet home. The market is hot so call your agent today for your private tour!

Listing Details

Address
3136 Mt Carmel Ave Avenue, New Waterford, B1H 1T2

Status
ACTIVE
Listing Price
$219,000
MLS®
202405896
Type
Single Family
Style
Detached
Age
48
Square Footage (MLA)
866  ft2
Total Fin SqFt (TLA)
866  ft2
PID
15467558
Bedrooms
3
Full Baths
1
Half Baths
0

Water
Municipal
Sewer
Municipal
Utilities
Cable,Electricity,High Speed Internet,Telephone

Building Specifications

Foundation Type
Poured Concrete
Roof
Asphalt Shingle
Exterior Finish
Vinyl
Flooring
Hardwood,Laminate,Vinyl

Looking for a Mortgage? Get Your Free Quote Started Today!

Rooms

LEVEL TYPE DIMENSIONS
Main Floor Kitchen 10.1x9.7
Main Floor Living Room 15.4x10.3
Main Floor Foyer 14.4x3.5
Main Floor Bedroom 12.9x9.8
Main Floor Bedroom 9.6x8
Main Floor Bedroom 9.6x7.10
Main Floor Bath 1 4pc

Garage & Parking

Garage
N
Details
---

Inclusions & Exclusions

Inclusions
Fridge and Stove

Sales History

Demographic Data

Demographic data is based on the dissemination area that contains the listing parcel . Dissemination Areas are small areas composed of one or more neighbouring dissemination blocks. All of Canada is divided into dissemination areas. Data source: Environics Analytics via ArcGIS Online, 2021

Population Size

507

Median Age

47.0

Avg Household Size

2.2

Avg House Income

$82K

The number of people for each age range.

How the population of this area is expected to change.

The highest level of education obtained by people within this area.

The maritial status of the people in this area.

The average household income within this area.

The number of people that rent versus own.

When the buildings in the area were constructed.

The number of children at home for the given age ranges.

The occupations of the people living here.

Tax Assessment

Year Amount % Change
2023 $132,600 ---
2022 $116,800 ---
2021 $108,800 ---
2020 $108,100 ---
2019 $74,100 ---
2018 $71,800 ---
2017 $69,700 ---
2016 $67,200 ---
2015 $65,200 ---
2014 $125,200 ---
2013 $60,700 ---
2012 $58,100 ---

Maps

Mortgage Inquiries

Last Updated On: 4/3/2024 10:18:28 AM (UTC)