175 Union Street, Sydney, (MLS® 202407822) RE/MAX nova
Google Play iOS Google Play iOS Google Play iOS

175 Union Street, Sydney

0 0 0 sqft
$289,999 Pending

Description

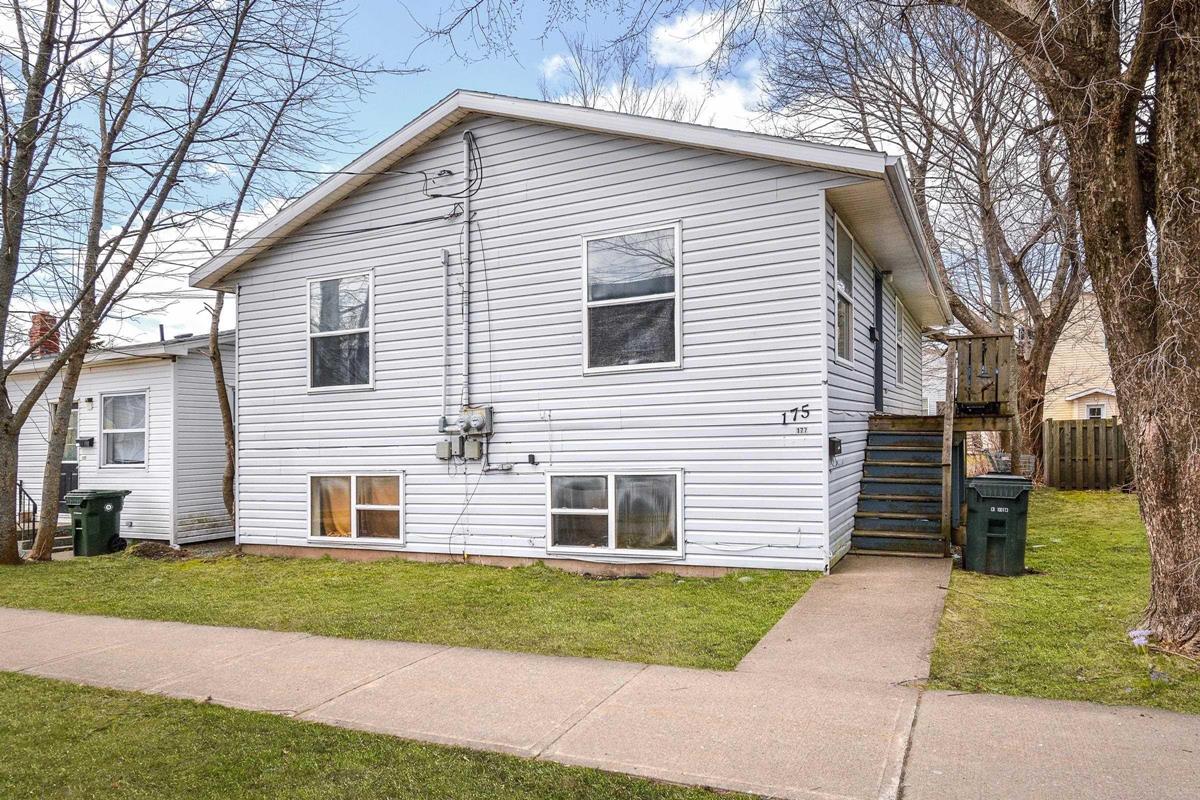
Welcome to 175-177 Union Street, where opportunity meets convenience! This solid duplex boasts not only good tenants but also a prime location with easy access to bus routes, ensuring a seamless blend of comfort and connectivity. Investors, rejoice! Both units are currently rented, promising a steady stream of income from day one. And for those seeking a rent-free lifestyle, envision yourself in one unit while the other takes care of the bills. But wait, there's more! Recent upgrades including roof shingles, flooring, and fresh paint mean less hassle for you and added value to this already enticing property. Tenants Pay their own heat and lights. Don't miss out on this chance to expand your portfolio or enjoy the perks of ownership with added financial freedom. Take the leap into your next real estate success story at 175-177 Union Street!

Listing Details

Address
175 Union Street, Sydney, B1P 4Y2

Status
PENDING
Listing Price
$289,999
MLS®
202407822
Type
n/a
Style
---
Age
34
PID
15598634

Water
Municipal
Sewer
Municipal
Utilities
---

Building Specifications

Foundation Type
Concrete
Roof
Asphalt Shingle
Exterior Finish
Vinyl
Flooring
Laminate,Linoleum

Looking for a Mortgage? Get Your Free Quote Started Today!

Garage & Parking

Garage
N
Details
---

Sales History

Demographic Data

Demographic data is based on the dissemination area that contains the listing parcel . Dissemination Areas are small areas composed of one or more neighbouring dissemination blocks. All of Canada is divided into dissemination areas. Data source: Environics Analytics via ArcGIS Online, 2021

Population Size

426

Median Age

41.5

Avg Household Size

2.0

Avg House Income

$65K

The number of people for each age range.

How the population of this area is expected to change.

The highest level of education obtained by people within this area.

The maritial status of the people in this area.

The average household income within this area.

The number of people that rent versus own.

When the buildings in the area were constructed.

The number of children at home for the given age ranges.

The occupations of the people living here.

Tax Assessment

Year Amount % Change
2024 $183,500 ---
2023 $134,000 ---
2022 $119,700 ---
2021 $122,200 ---
2020 $120,900 ---
2019 $116,100 ---
2018 $114,200 ---
2017 $112,300 ---
2016 $109,400 ---
2015 $111,100 ---
2014 $221,000 ---
2013 $108,100 ---
2012 $98,700 ---

Maps

Mortgage Inquiries

Last Updated On: 5/1/2024 2:17:59 PM (UTC)