511 Main Street, Lawrencetown, (MLS® 202402176) RE/MAX nova
Google Play iOS Google Play iOS Google Play iOS

511 Main Street, Lawrencetown

0 0 0 sqft
Sold

Description

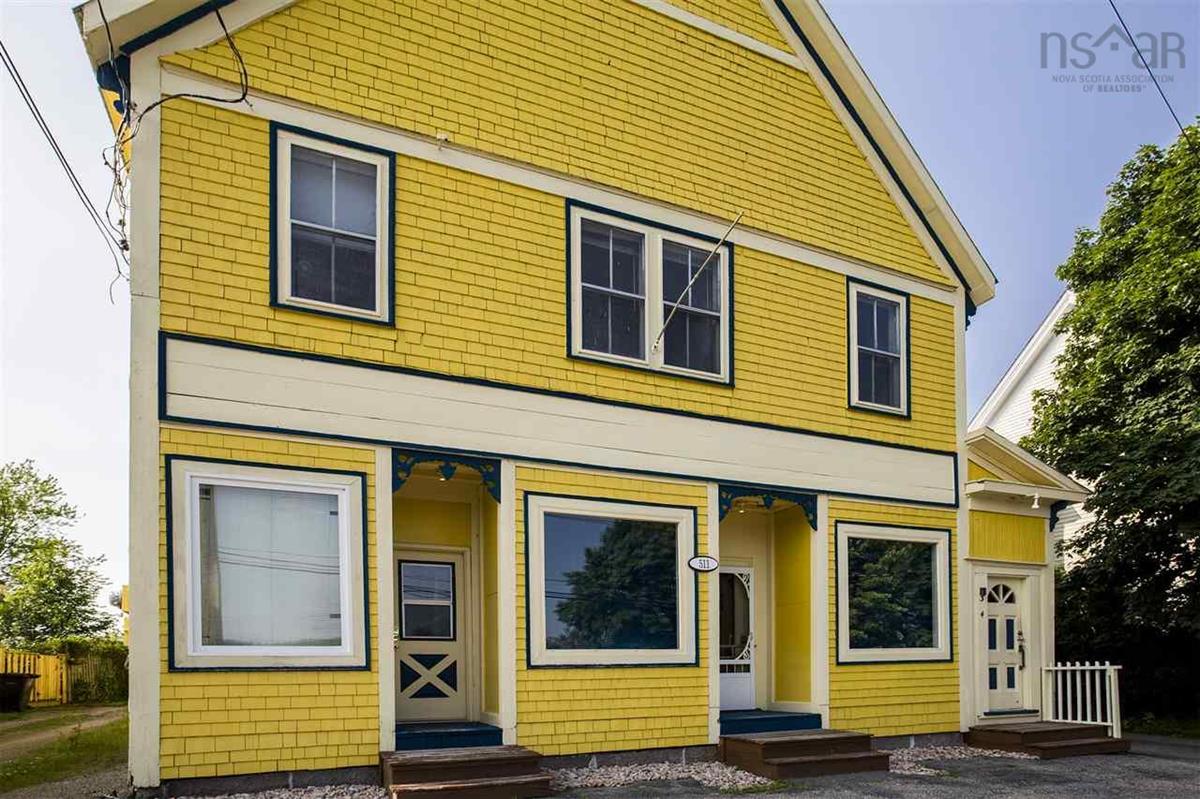
Fully furnished and strategically located, this 5-unit apartment building is in close proximity to NSCC-COGS, historically favoured by students for 10-month rentals. The majority of units are successfully leased for the 2023-2024 academic year, attesting to its popularity. Explore the possibility of adding a 6th unit to maximize rental potential, or rent as a commercial space (ground level). With an impressive rental track record, all systems are in optimal condition, ensuring a hassle-free ownership experience. Don't miss this opportunity to invest in a property with a proven history of success in a sought-after student housing market. [Please note: all pictures displayed were taken in 2021 but are still accurate. Also available for sale from same owner is 509 Main Street, next door.]

Listing Details

Address
511 Main Street, Lawrencetown, B0S 1M0

Status
SOLD
Sold Price
Log In
MLS®
202402176
Type
n/a
Style
---
Age
124
PID
05125281

Water
Municipal
Sewer
Municipal
Utilities
---

Building Specifications

Foundation Type
Stone
Roof
Metal
Exterior Finish
Wood Siding
Flooring
Softwood,Vinyl

Looking for a Mortgage? Get Your Free Quote Started Today!

Garage & Parking

Garage
N
Details
---

Sales History

Demographic Data

Demographic data is based on the dissemination area that contains the listing parcel . Dissemination Areas are small areas composed of one or more neighbouring dissemination blocks. All of Canada is divided into dissemination areas. Data source: Environics Analytics via ArcGIS Online, 2021

Population Size

562

Median Age

50.9

Avg Household Size

2.1

Avg House Income

$60K

The number of people for each age range.

How the population of this area is expected to change.

The highest level of education obtained by people within this area.

The maritial status of the people in this area.

The average household income within this area.

The number of people that rent versus own.

When the buildings in the area were constructed.

The number of children at home for the given age ranges.

The occupations of the people living here.

Tax Assessment

Year Amount % Change
2023 $142,600 ---
2022 $125,000 ---
2021 $122,000 ---
2020 $123,700 ---
2019 $120,600 ---
2018 $118,700 ---
2017 $130,200 ---
2016 $130,400 ---
2015 $146,600 ---
2014 $293,200 ---
2013 $141,600 ---
2012 $138,800 ---

Maps

Mortgage Inquiries

Last Updated On: 4/10/2024 12:00:00 AM (UTC)