843 Main Street, Sydney Mines, (MLS® 202402698) RE/MAX nova
Google Play iOS Google Play iOS Google Play iOS

843 Main Street, Sydney Mines

0 0 1650 sqft
$189,000 For Sale

Description

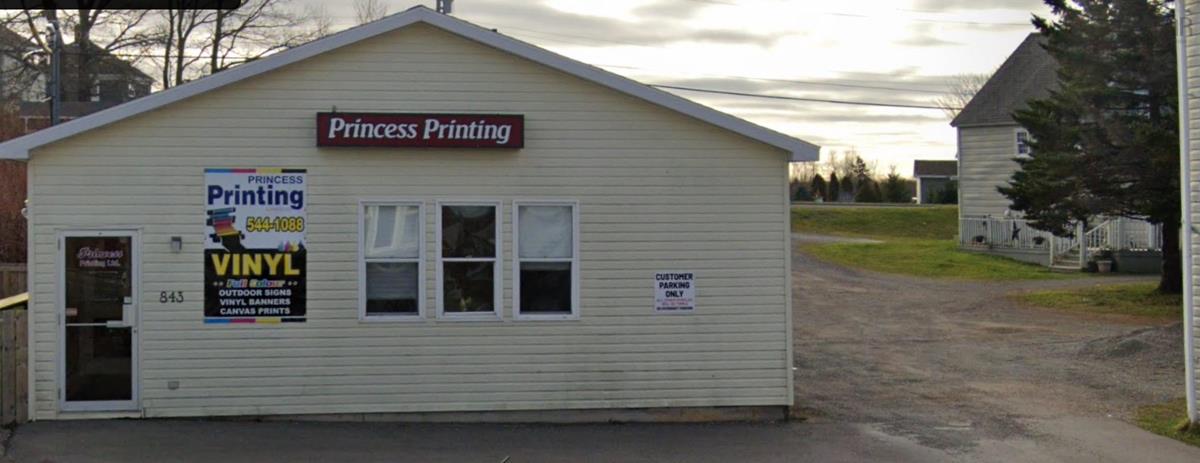
Endless possibilities! Twenty year old, slab on grade, 1650 sq foot building with entrance and parking from Main St Sydney Mines AND rear parking and access from Butts Street. The front of the building consists of a main entrance 15 x 4 hallway, with access upon entering, to a 26x15 separate unit with half bath and additional sink. The former print shop is 30x42 , has both a person door and 8x9 garage door and a separate office and 2pc bath. The space is wide open and can be easily restructured for a multitude of uses. The roof was reshingled in 2023 and the building has two services 100 amp and 200amp with 3 phase power. A ventilation system is located in the shop area. The zoning is mixed use so the potential, upon confirmation with CBRM, is there to create a living space with attached garage, a granny suite in front or rental unit, your own business or open up for additional living space. As stated earlier endless possibilities!

Listing Details

Address
843 Main Street, Sydney Mines, B1V 2L9

Status
ACTIVE
Listing Price
$189,000
MLS®
202402698
Type
n/a
Style
---
Age
20
Square Footage (MLA)
1,650  ft2
Total Fin SqFt (TLA)
1,650  ft2
PID
15165855

Water
Municipal
Sewer
---
Utilities
Cable,Electrical,Municipal Water,Sewer,Telephone

Building Specifications

Foundation Type
---
Roof
Asphalt Shingle
Exterior Finish
---
Flooring
Other
RE/MAX Commercial

Garage & Parking

Garage
N
Details
---

Sales History

Demographic Data

Demographic data is based on the dissemination area that contains the listing parcel . Dissemination Areas are small areas composed of one or more neighbouring dissemination blocks. All of Canada is divided into dissemination areas. Data source: Environics Analytics via ArcGIS Online, 2021

Population Size

693

Median Age

47.4

Avg Household Size

2.3

Avg House Income

$72K

The number of people for each age range.

How the population of this area is expected to change.

The highest level of education obtained by people within this area.

The maritial status of the people in this area.

The average household income within this area.

The number of people that rent versus own.

When the buildings in the area were constructed.

The number of children at home for the given age ranges.

The occupations of the people living here.

Tax Assessment

Year Amount % Change
2023 $131,700 ---
2022 $120,100 ---
2021 $119,100 ---
2020 $121,900 ---
2019 $119,400 ---
2018 $133,900 ---
2017 $133,100 ---
2016 $136,000 ---
2015 $136,300 ---
2014 $265,200 ---
2013 $135,000 ---
2012 $137,100 ---

Maps

Last Updated On: 2/23/2024 3:31:40 PM (UTC)