Description
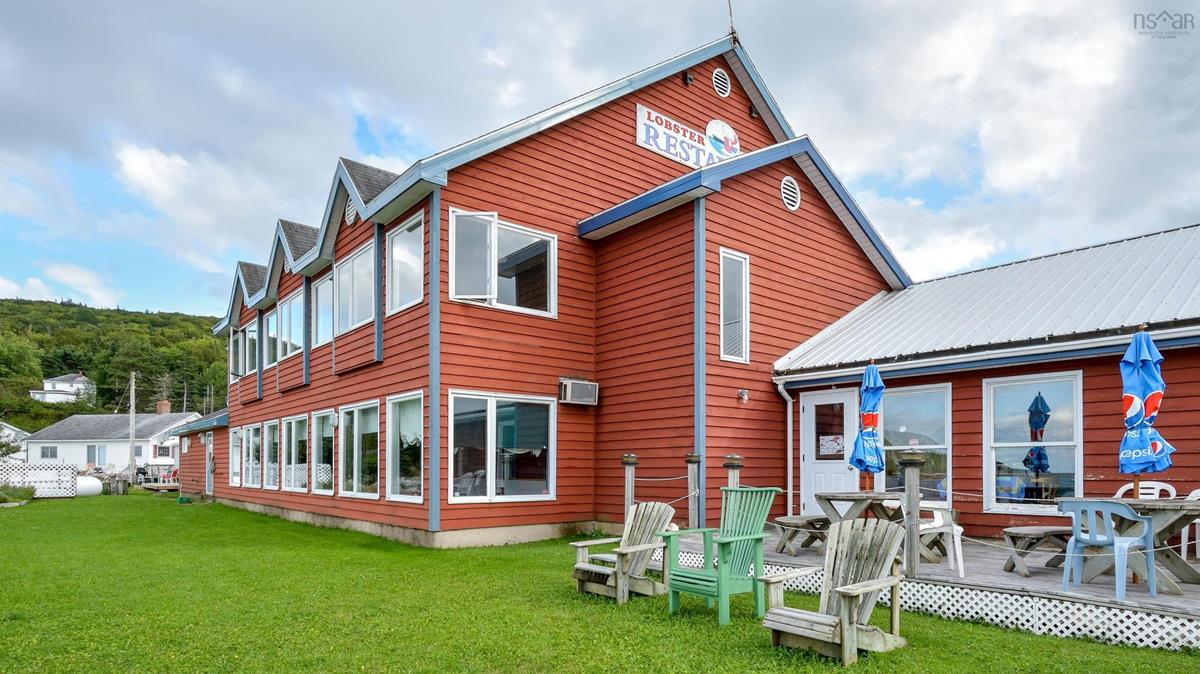
***MOTIVATED SELLERS*** Ready for someone to take over and profit from the 2024 season! To the ENTREPRENEURS among us. What is YOUR VISION? The 250' of WATERFRONT at the head of ST. ANNS comes with ENDLESS VIEWS down the Harbour towards the Atlantic. Ideal HIGH-TRAFFIC DESTINATION with CURB APPEAL, centrally located on CAPE BRETON ISLAND, just off of HWY 105 & the CABOT TRAIL. Currently the property is a successful 100 seat fully equipped RESTAURANT, with attached LOBSTER POUND, gift shop + 2 Bed Apartment with office space & Stunning Large Event Room. WHERE WILL YOUR IMAGINATION take this UNIQUE WATERFRONT OPPORTUNITY? A beautiful community to LIVE WHERE YOU WORK! Water Recreation? Rental Housing or Offices? Events? Gift/Gallery/Museum? Food Service/Seafood Market/Pound? The ideas are plentiful and success inevitable at this central location off of the corner of Trans Canada Highway and Cabot Trail. Recreational activities: swimming, boating, fishing... The 1/3 ACRE +- LEVEL PROPERTY is landscaped including PAVED PARKING, Plantings and SHORELINE PROTECTION. OR develop in to your waterfront dream home! Almost 8000 SQFT of floor space. COVERED DECK, CEDAR SIDING. Call today for your personal tour and see for yourself.
Listing Details
51943 CABOT TRAIL Road, St. Anns, B0E 1B0
ACTIVE
$995,000
202320558
n/a
---
7,950 ft2
7,950 ft2
85026094
Drilled Well
---
Electrical,Septic,Telephone,Other
Building Specifications
---
Asphalt Shingle,Metal
---
Other