887 Main Street, Sydney Mines, (MLS® 202226688) RE/MAX nova
Google Play iOS Google Play iOS Google Play iOS

887 Main Street, Sydney Mines

3 1 1576 sqft
Sold

Description

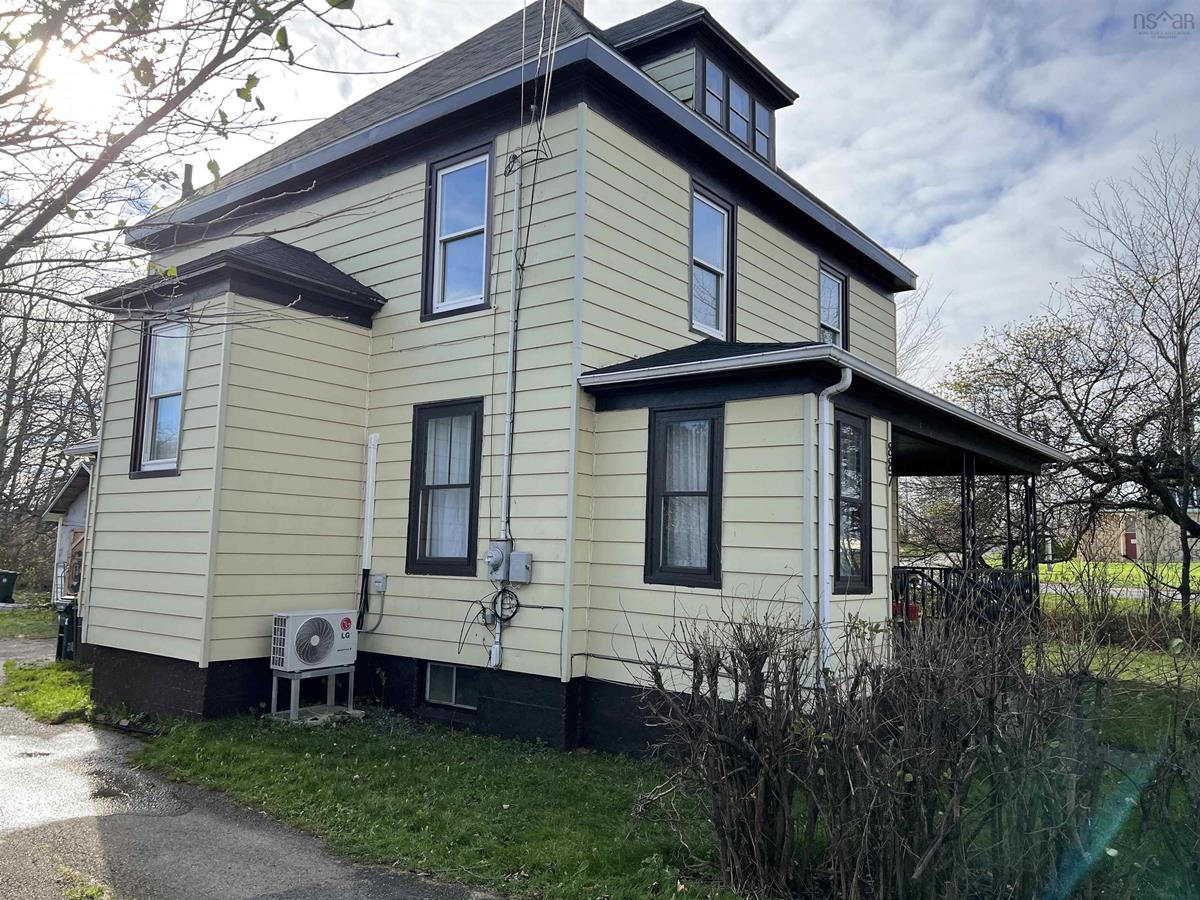
Solid century home on a 1/3 acre lot in the heart of Sydney Mines. Walking distance to all amenities make this a perfect family home. The rear entry is a convenient porch /laundry combination and flows into an eat in kitchen with rear pantry and attached dining room. To the front is a living room and family room. On the second level 3 bedrooms and a large 4 piece bath are housed.

Listing Details

Address
887 Main Street, Sydney Mines, B1V 2L9

Status
SOLD
Sold Price
Log In
MLS®
202226688
Type
Single Family
Style
Detached
Age
94
Square Footage (MLA)
1,576  ft2
Total Fin SqFt (TLA)
1,576  ft2
PID
15165772
Bedrooms
3
Full Baths
1
Half Baths
0

Water
Municipal
Sewer
Municipal
Utilities
Cable,Electricity,High Speed Internet,Telephone

Building Specifications

Foundation Type
Poured Concrete
Roof
Asphalt Shingle
Exterior Finish
Vinyl
Flooring
Laminate,Other

Looking for a Mortgage? Get Your Free Quote Started Today!

Rooms

LEVEL TYPE DIMENSIONS
Main Floor Kitchen 11 6 x 13 9
Main Floor Dining Room 11 6 X 11 6
Main Floor Family Room 13 1 X 10 10
Main Floor Living Room 13 5 x 13 6
Main Floor Laundry 5 4 x 7 11
Main Floor OTHER 5 3 x 8 8
2nd Level Primary Bedroom 13 3 X 12 5
2nd Level Bedroom 12 7 x 11 2
2nd Level Bedroom 12 5 X 10 11
2nd Level Bath 1 7 1 x 9 4

Garage & Parking

Garage
N
Details
---

Sales History

Demographic Data

Demographic data is based on the dissemination area that contains the listing parcel . Dissemination Areas are small areas composed of one or more neighbouring dissemination blocks. All of Canada is divided into dissemination areas. Data source: Environics Analytics via ArcGIS Online, 2021

Population Size

693

Median Age

47.4

Avg Household Size

2.3

Avg House Income

$72K

The number of people for each age range.

How the population of this area is expected to change.

The highest level of education obtained by people within this area.

The maritial status of the people in this area.

The average household income within this area.

The number of people that rent versus own.

When the buildings in the area were constructed.

The number of children at home for the given age ranges.

The occupations of the people living here.

Tax Assessment

Year Amount % Change
2023 $141,100 ---
2022 $117,000 ---
2021 $104,300 ---
2020 $103,700 ---
2019 $106,600 ---
2018 $102,500 ---
2017 $101,600 ---
2016 $100,700 ---
2015 $96,200 ---
2014 $188,800 ---
2013 $90,100 ---
2012 $87,100 ---

Maps

Mortgage Inquiries

Last Updated On: 4/28/2023 12:00:00 AM (UTC)