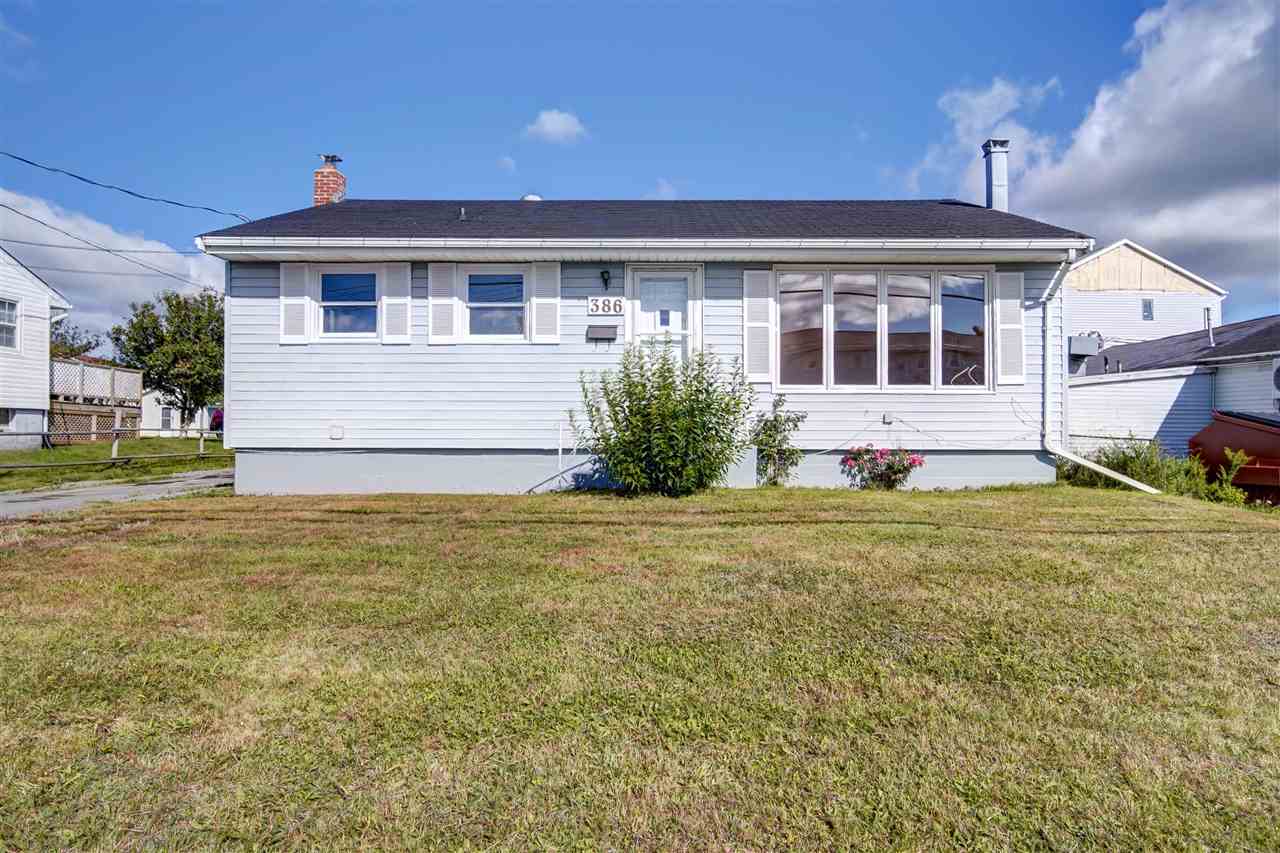
386 Cow Bay Road, Eastern Passage, (MLS® 202017199) RE/MAX nova
Google Play iOS Google Play iOS Google Play iOS

386 Cow Bay Road, Eastern Passage

3 2 1564 sqft
Sold

Description

Well priced bungalow with 2 garages in the heart of Eastern Passage. This bungalow features hardwood floors in living room & bedrooms that are in very good condition. Has recently been painted throughout with downstairs featuring new flooring, baseboards & paint. This home features two 4 pc baths. Come take a look, will not last long.

Listing Details

Address
386 Cow Bay Road, Eastern Passage, B3G 1J4

Status
SOLD
MLS®
202017199
Type
Single Family
Style
Detached
Age
58
Square Footage (MLA)
885  ft2
Total Fin SqFt (TLA)
1,564  ft2
PID
40082265
Bedrooms
3
Full Baths
2
Half Baths
0

Water
Municipal
Sewer
Municipal
Utilities
Cable,Electricity,High Speed Internet,Telephone

Building Specifications

Foundation Type
Poured Concrete
Roof
Asphalt Shingle
Exterior Finish
Vinyl
Flooring
Hardwood,Laminate,Vinyl

Looking for a Mortgage? Get Your Free Quote Started Today!

Rooms

LEVEL TYPE DIMENSIONS
Basement Bath 2 4 pc

Garage & Parking

Garage
Y
Details
Double & single detached, garage doors do not open properly

Inclusions & Exclusions

Inclusions
Fridge

Sales History

Halifax Regional Municipality Data

Zoning
R-2
By-Law Code: 6
By-Law Area
Eastern Passage/Cow Bay
By-Law Code: EPCB
Polling District
Dartmouth South - Eastern Passage
Concillor: Becky Kent
Waste Collection
THURSDAY
Contractor: REgroup

Demographic Data

Demographic data is based on the dissemination area that contains the listing parcel . Dissemination Areas are small areas composed of one or more neighbouring dissemination blocks. All of Canada is divided into dissemination areas. Data source: Environics Analytics via ArcGIS Online, 2021

Population Size

1653

Median Age

36.8

Avg Household Size

2.4

Avg House Income

$81K

The number of people for each age range.

How the population of this area is expected to change.

The highest level of education obtained by people within this area.

The maritial status of the people in this area.

The average household income within this area.

The number of people that rent versus own.

When the buildings in the area were constructed.

The number of children at home for the given age ranges.

The occupations of the people living here.

Tax Assessment

Year Amount % Change
2021 $157,600 ---
2020 $155,200 ---
2019 $154,300 ---
2018 $153,000 ---
2017 $154,600 ---
2016 $161,600 ---
2015 $162,500 ---
2014 $159,700 ---
2013 $160,400 ---
2012 $148,400 ---

Maps

Mortgage Inquiries

Last Updated On: 12/8/2020 1:48:49 PM (UTC)